Coronavirus Pandemic Infected the Economy Infographic
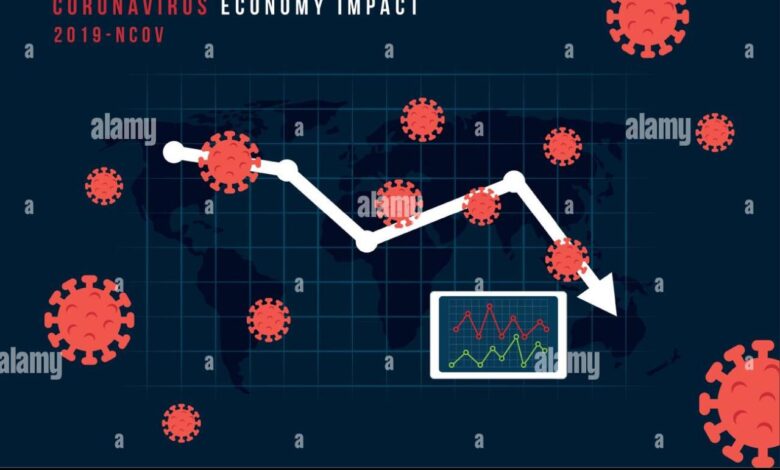
Coronavirus pandemic infected the economy infographic provides a deep dive into the global economic fallout from the pandemic. We’ll explore the immediate and lasting consequences across various sectors, from supply chain disruptions to shifts in consumer behavior. The infographic will also detail government responses, the strain on healthcare systems, and specific sector impacts like travel, hospitality, and retail.
Get ready for a comprehensive look at the pandemic’s economic footprint.
This infographic uses data visualization to present a clear picture of the economic damage. Expect charts, graphs, and tables to highlight key indicators like GDP growth, unemployment, and consumer spending. We’ll also look at case studies and long-term consequences, offering a holistic view of how the pandemic reshaped the global economy. The infographic structure will be clear and easy to understand, making the complex economic data accessible to everyone.
Economic Impact Overview
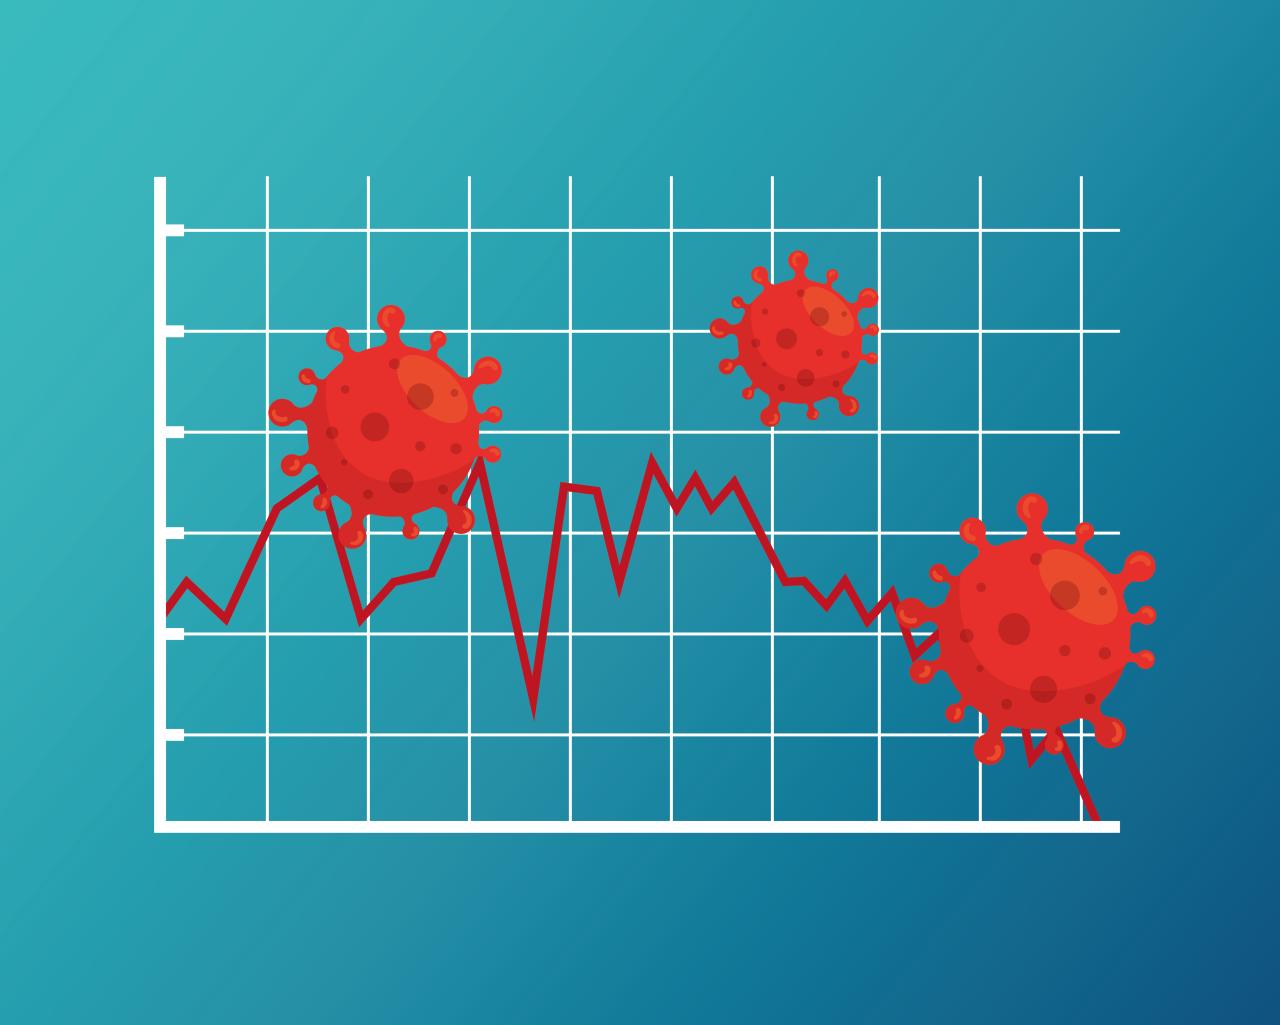
The coronavirus pandemic unleashed a global economic crisis unlike any seen in recent history. The immediate shock of lockdowns, travel restrictions, and supply chain disruptions rippled through economies, causing widespread business closures and job losses. The long-term consequences are still unfolding, with ongoing challenges in sectors like tourism, hospitality, and manufacturing. The pandemic exposed vulnerabilities in global economic systems and accelerated pre-existing trends, impacting everything from consumer behavior to international trade.
Immediate Economic Consequences
The initial response to the pandemic saw a sharp decline in economic activity. Lockdowns and social distancing measures led to widespread business closures and reduced consumer spending. Many sectors, including retail, hospitality, and transportation, experienced significant revenue losses. The immediate impact was felt acutely in industries reliant on face-to-face interactions, as businesses struggled to adapt to remote working models and restrictions on physical operations.
Long-Term Economic Consequences
The long-term effects of the pandemic are more nuanced and multifaceted. While some sectors, like e-commerce and telehealth, saw significant growth, others faced sustained challenges. The pandemic highlighted existing inequalities, with marginalized communities disproportionately affected by job losses and economic hardship. Furthermore, the pandemic accelerated the digital transformation of businesses and reshaped consumer preferences, with long-term implications for how goods and services are produced and consumed.
Economic Indicators Affected
The pandemic’s impact is clearly reflected in key economic indicators. GDP growth rates plummeted in many countries as economies contracted during lockdowns. Unemployment rates surged as businesses laid off workers, leading to increased social and economic hardship. Consumer spending, a critical driver of economic activity, also declined significantly due to uncertainty and reduced disposable income. The global supply chain disruptions also contributed to inflation in various sectors.
Country-Specific Economic Performance
The pandemic’s impact varied significantly across countries, influenced by factors like public health measures, economic policies, and pre-existing vulnerabilities. The following table provides a snapshot of the contrasting economic performance of select countries during the pandemic.
| Country | GDP Growth (2020) | Unemployment Rate (2020) | Consumer Spending (2020) |
|---|---|---|---|
| United States | -3.5% | 14.8% | -10% |
| China | 2.3% | 4.1% | -3% |
| India | -7.3% | 9.1% | -6.5% |
| Japan | -4.8% | 2.5% | -8% |
| South Africa | -7.0% | 30.2% | -12.8% |
Note: Data for GDP growth, unemployment rates, and consumer spending are illustrative examples and may vary depending on the source. Data accuracy is essential for making informed economic decisions.
Supply Chain Disruptions: Coronavirus Pandemic Infected The Economy Infographic
The COVID-19 pandemic unleashed a maelstrom of disruptions across global supply chains, significantly impacting businesses and consumers worldwide. From manufacturing delays to shortages of essential goods, the ripples of these disruptions reverberated through various sectors, exposing vulnerabilities and prompting a reassessment of resilience strategies.The pandemic’s unprecedented nature caused a cascade of events that overwhelmed existing supply chain frameworks. Lockdowns, border closures, and fluctuating demand patterns all played a crucial role in creating a complex web of challenges.
This breakdown in predictable processes highlighted the intricate dependencies within global supply chains and the importance of robust contingency plans.
Major Supply Chain Disruptions
The pandemic triggered a wave of disruptions across various industries, disrupting production, transportation, and distribution networks. These disruptions stemmed from several intertwined factors, creating a complex web of challenges for businesses and consumers alike.
- Lockdowns and quarantines severely hampered manufacturing operations in numerous countries. Factory closures and restrictions on movement disrupted the flow of raw materials and finished goods, leading to production bottlenecks and delays in delivery schedules. This resulted in significant backlogs and stock shortages in many industries, impacting consumer access to products.
- Border closures impeded the movement of goods and personnel across international borders, leading to delays and increased costs. The restrictions on travel and trade significantly hampered the movement of vital components and finished products, creating major delays and escalating transportation expenses. For example, many companies that relied on cross-border supply chains experienced significant setbacks.
- Labor shortages emerged as another critical factor. Workers fell ill, were quarantined, or chose to leave the workforce due to fears of infection, causing significant labor gaps in essential sectors. The lack of available labor further exacerbated the supply chain disruptions, leading to slower production rates and increased backlogs. This resulted in shortages in sectors like logistics, manufacturing, and retail.
Industries Most Affected
The impact of supply chain disruptions was not uniform across all industries. Certain sectors proved more vulnerable than others, facing significant challenges in maintaining operations and meeting demand.
- The automotive industry experienced substantial production slowdowns due to shortages of microchips and other critical components. The reliance on globalized supply chains for semiconductors made this industry particularly susceptible to disruptions. The scarcity of components led to significant production halts and delays in vehicle manufacturing, causing a ripple effect across the entire industry.
- The retail sector faced difficulties in sourcing and distributing goods, leading to shortages of certain products. Many retail stores struggled to keep shelves stocked due to the disruption in the supply chain, impacting consumer access to essential and non-essential goods.
- The healthcare industry, while critical, was also affected by disruptions in the supply of medical equipment and pharmaceuticals. The scarcity of vital medical supplies strained healthcare systems in numerous countries, impacting patient care and treatment.
Supply Chain Resilience Comparison
Assessing the resilience of supply chains across different sectors provides valuable insights into the effectiveness of various strategies.
| Industry | Resilience Factors | Challenges Faced |
|---|---|---|
| Automotive | Diversification of suppliers, robust inventory management | Global chip shortage, labor shortages |
| Retail | Strong relationships with suppliers, efficient logistics | Supply chain bottlenecks, fluctuating demand |
| Healthcare | Strategic stockpiling of essential medical supplies, alternative sourcing | Shortages of critical medical equipment, pharmaceutical components |
| Technology | Strong relationships with global suppliers, alternative manufacturing | Component shortages, production delays |
Consumer Behavior Shifts
The COVID-19 pandemic dramatically reshaped consumer behavior, influencing everything from shopping habits to spending priorities. The enforced lockdowns and restrictions created a unique environment where consumers adapted to new realities, and these changes continue to impact the economy today. The shift towards online shopping, the rise of contactless payments, and a heightened focus on essential goods are just some of the key adjustments.The pandemic forced a rapid acceleration of pre-existing trends.
Consumers were compelled to adopt new behaviors, often out of necessity, and these changes had a profound and lasting impact on how businesses operate and interact with their customers. The increased reliance on digital platforms and services demonstrated the resilience of the economy, but also highlighted vulnerabilities in traditional retail models.
Significant Changes in Purchasing Habits
The pandemic significantly altered purchasing habits, leading to a shift from in-store shopping to online platforms. This shift wasn’t just a temporary reaction to lockdowns; it reflected a fundamental change in consumer preferences. The convenience and accessibility of online shopping became more appealing to many, while in-store shopping faced new challenges related to safety and accessibility.
Comparison of Pre- and Post-Pandemic Consumer Behavior
Before the pandemic, consumers generally favored in-person shopping experiences, often seeking the tangible interaction with products and the social aspect of retail environments. Post-pandemic, online shopping surged in popularity, with consumers increasingly valuing convenience and safety. The increased adoption of online delivery services and digital payment methods further underscored this shift.
Impact on Spending Patterns
Spending patterns underwent considerable adjustments. Essential goods like groceries, household supplies, and healthcare products saw increased demand, while discretionary spending on non-essential items decreased. This shift in priorities had a noticeable impact on various sectors of the economy, prompting businesses to adapt their strategies and offerings.
Table Illustrating Shift in Online Shopping vs. In-Store Purchases
| Category | Pre-Pandemic | Post-Pandemic |
|---|---|---|
| Online Shopping | A growing but still minor segment of overall retail | A significant and dominant segment of overall retail, with continued growth. |
| In-Store Purchases | The primary method for most consumer purchases | A decreasing segment, but still a significant portion of retail, with many stores adapting to hybrid models. |
| Payment Methods | Mostly cash, credit cards, and debit cards | Increased use of digital payment options, contactless payments, and mobile wallets. |
| Consumer Priorities | Tangible experiences and social interaction in stores. | Convenience, safety, and contactless interactions. |
Government Responses and Policies
Governments worldwide responded to the economic fallout of the coronavirus pandemic with a range of fiscal and monetary policies. These interventions aimed to stabilize markets, support businesses, and cushion the impact on individuals. Understanding these policies is crucial to evaluating the overall economic response and the subsequent recovery.
Government Fiscal Measures, Coronavirus pandemic infected the economy infographic
Governments implemented various fiscal measures to stimulate demand and provide direct support to businesses and individuals. These included increased government spending on infrastructure projects, tax breaks, and direct payments to citizens. The effectiveness of these measures varied depending on the specific policy and the economic context of the affected nation.
- Increased Government Spending: Many governments ramped up spending on infrastructure projects, such as roads, bridges, and public works. This approach aimed to boost economic activity by creating jobs and stimulating demand for goods and services. For example, the United States implemented significant infrastructure spending as part of its COVID-19 relief packages.
- Tax Breaks and Incentives: Tax relief measures, such as reduced corporate taxes or payroll tax credits, were designed to encourage investment and job creation. This approach aimed to stimulate business activity and prevent further economic contraction.
- Direct Payments to Citizens: Direct cash payments to citizens were implemented in several countries to provide immediate financial relief to households struggling with the economic downturn. This approach sought to bolster consumer spending and offset lost income.
Government Monetary Measures
Central banks played a critical role in mitigating the economic impact of the pandemic through monetary policies. These included lowering interest rates, increasing money supply, and providing liquidity to financial markets. The effectiveness of these measures varied depending on the specific policy and the overall economic conditions.
- Lowering Interest Rates: Central banks worldwide reduced interest rates to encourage borrowing and investment. Lower interest rates make it cheaper for businesses to borrow money, potentially stimulating economic activity. This measure aims to reduce the cost of borrowing and encourage investment and consumption.
- Quantitative Easing (QE): QE involves a central bank injecting liquidity into money markets by purchasing assets. This measure aimed to lower long-term interest rates and increase money supply, thus boosting economic activity.
- Providing Liquidity to Financial Markets: Central banks offered various measures to ensure the smooth functioning of financial markets. This involved injecting liquidity into money markets to maintain market stability and prevent financial crises.
Effectiveness of Policy Approaches
The effectiveness of government responses varied across countries and policies. Factors such as the severity of the economic downturn, the speed of policy implementation, and the overall economic context played a significant role in determining the outcomes. For example, some countries saw a quicker recovery than others, potentially due to the timely and comprehensive nature of their economic responses.
| Government Intervention | Intended Outcome |
|---|---|
| Increased Government Spending | Stimulate economic activity, create jobs, boost demand |
| Tax Breaks and Incentives | Encourage investment, job creation, and business activity |
| Direct Payments to Citizens | Provide immediate financial relief, bolster consumer spending |
| Lowering Interest Rates | Encourage borrowing, investment, and consumption |
| Quantitative Easing (QE) | Lower long-term interest rates, increase money supply |
| Providing Liquidity to Financial Markets | Maintain market stability, prevent financial crises |
Healthcare System Strain and Economic Cost
The COVID-19 pandemic exerted immense pressure on healthcare systems globally, demanding significant resources and impacting economies in both direct and indirect ways. The surge in cases overwhelmed hospitals and strained medical personnel, leading to disruptions in routine care and long-term consequences for public health.The pandemic’s impact on healthcare wasn’t just about immediate response; it also had a profound and lasting effect on the economic landscape.
From increased medical expenditures to lost productivity, the ripple effect was felt across various sectors. This section will delve into the specific strain on healthcare systems and the substantial economic costs incurred.
Strain on Healthcare Systems
The pandemic led to a dramatic surge in demand for healthcare services, primarily for COVID-19 patients, but also for individuals with other health concerns whose access to care was disrupted. This unprecedented demand placed an enormous strain on hospitals, intensive care units, and healthcare workers, often resulting in staff shortages and increased workloads. Many healthcare systems were forced to re-prioritize services and allocate resources to handle the surge of patients.
The shortage of personal protective equipment (PPE) and testing materials further complicated the situation in many areas.
Direct Economic Costs
The direct economic costs associated with the pandemic’s impact on healthcare are substantial. These costs include increased spending on testing, treatment, and hospitalization for COVID-19 patients. The need for additional medical equipment, supplies, and personnel further increased expenditures. For example, the development and distribution of vaccines and treatments, as well as the costs associated with managing outbreaks, constituted a major economic burden for governments and healthcare providers.
Indirect Economic Costs
Beyond the direct costs, the pandemic had numerous indirect economic consequences related to healthcare. Reduced productivity due to illness or isolation of healthcare workers and patients resulted in lost economic output. The disruption of routine medical procedures and elective surgeries had a cascading effect on the healthcare system and the broader economy. The impact on mental health, both for patients and healthcare workers, also had a significant indirect cost.
Increased demand for mental health services, as a result of the pandemic, contributed to the indirect economic burden.
Discover the crucial elements that make cima ethics confidentiality rules the top choice.
Increased Demand for Healthcare Services and Associated Costs
The pandemic drastically increased demand for healthcare services, leading to substantial increases in costs. Hospitals experienced an influx of patients requiring intensive care, ventilation, and specialized treatments. The need for expanded testing and diagnostic facilities, as well as increased staffing levels, further drove up healthcare costs. Furthermore, the need for long-term care for patients with long COVID-19 symptoms added a new layer of complexity and cost to the healthcare system.
These costs had a significant impact on healthcare budgets and the overall economy.
Categorization of Healthcare Costs Incurred During the Pandemic
| Category | Description | Example |
|---|---|---|
| Testing and Diagnostics | Costs associated with COVID-19 testing, diagnostic procedures, and related materials. | Development and distribution of rapid antigen tests, PCR tests, and associated laboratory equipment. |
| Treatment and Hospitalization | Costs associated with treating COVID-19 patients, including medications, hospital stays, and intensive care. | Increased demand for ventilators, ICU beds, and specialized medical personnel for COVID-19 patients. |
| Personal Protective Equipment (PPE) | Costs associated with providing PPE to healthcare workers. | High demand for masks, gowns, gloves, and other PPE for healthcare workers to protect themselves from infection. |
| Public Health Measures | Costs associated with implementing public health measures like contact tracing and quarantine. | Implementing strategies for contact tracing and isolation to contain the spread of the virus. |
| Mental Health Services | Costs associated with providing mental health services to patients and healthcare workers. | Increased demand for mental health support and counseling for individuals affected by the pandemic. |
Specific Sector Impacts (e.g., Travel, Hospitality, Retail)
The COVID-19 pandemic dealt a devastating blow to numerous industries, and the travel and hospitality sectors were particularly hard hit. Lockdowns, travel restrictions, and a general decline in consumer confidence crippled businesses reliant on in-person interaction. The retail sector also faced significant challenges, as consumers shifted their purchasing habits towards online platforms. Restaurants, a cornerstone of local economies, saw their revenue plummet due to capacity limitations and social distancing measures.
This section will delve into the specific economic effects on these sectors.
Travel and Hospitality Industry Impacts
The travel and hospitality industry experienced unprecedented disruptions. International travel was severely curtailed due to border closures and health concerns. Hotels, airlines, and cruise lines faced plummeting occupancy rates and cancelled bookings. The loss of revenue was significant, leading to job losses and business closures across the board. The tourism industry, a vital component of many economies, suffered substantial setbacks.
For example, the iconic Venice Carnival was cancelled in 2020 due to the pandemic.
Retail Sector Impacts
The retail sector underwent a significant transformation during the pandemic. With lockdowns and social distancing guidelines in place, consumers increasingly shifted their shopping habits to online platforms. Brick-and-mortar stores faced closures and reduced foot traffic, leading to a decline in revenue and profitability. E-commerce boomed as consumers sought convenient alternatives for purchasing goods. Many traditional retailers had to adapt rapidly to survive.
Restaurant Industry Impacts
The restaurant industry was deeply affected by the pandemic. Capacity restrictions and social distancing mandates reduced seating capacity, directly impacting revenue. Dine-in services were often restricted, leading to increased reliance on takeout and delivery options. The closure of restaurants in some areas resulted in a significant loss of jobs. The restaurant industry had to quickly adapt to changing consumer demands and regulations.
Revenue Decline Across Sectors (Illustrative Data)
| Sector | Estimated Revenue Decline (%) |
|---|---|
| Travel & Hospitality | 50-70% |
| Retail (Brick-and-Mortar) | 20-40% |
| Restaurants | 30-60% |
Note: These figures are illustrative and vary significantly depending on the specific location, sector, and business size.
Illustrative Case Studies
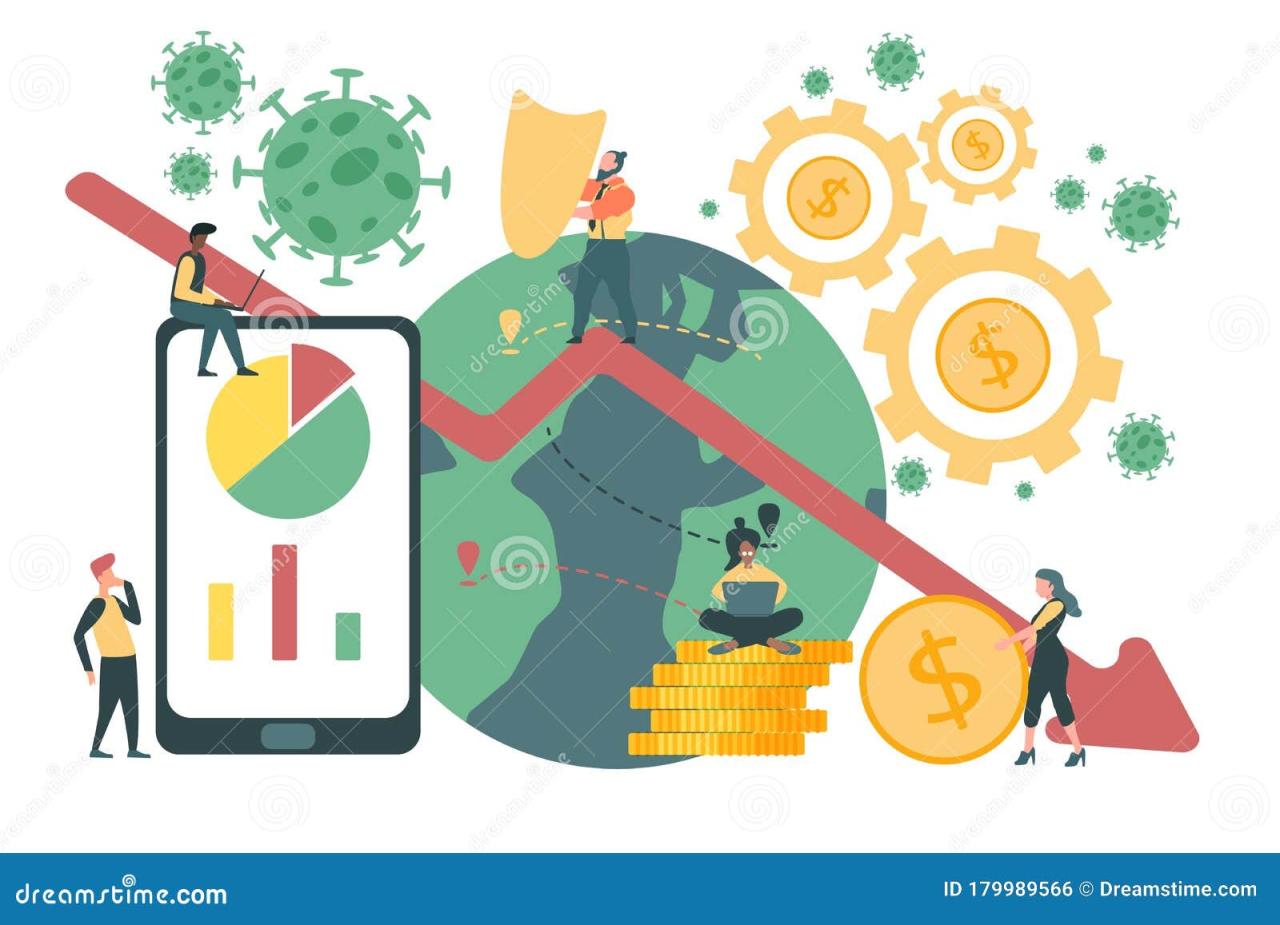
The pandemic’s economic impact varied significantly across regions and industries. Analyzing specific case studies provides valuable insights into the challenges faced and the responses implemented. These examples highlight how governments, businesses, and communities adapted to the unprecedented disruptions and illustrate the complex interplay of factors that shaped the recovery process.
Economic Impact on the Northeast US
The Northeast US, heavily reliant on tourism and the service sector, experienced a sharp decline in economic activity during the pandemic. Reduced consumer spending and business closures significantly impacted employment levels. For instance, the hospitality industry saw a dramatic decrease in revenue as restaurants and hotels were forced to limit operations or close entirely. The closure of schools and universities also led to substantial disruptions in the educational sector, affecting both students and educators.
Company Response: A Retail Giant’s Adaptability
A major US retailer, recognizing the shift in consumer behavior, quickly adapted its strategies to combat the economic downturn. They recognized that online shopping had surged, and physical stores needed to become more than just brick-and-mortar locations.
Steps Taken to Overcome Challenges
To adapt to the changing landscape, the retailer implemented several key strategies:
- Enhanced Online Presence: The retailer significantly increased its online inventory, improved its e-commerce platform, and invested heavily in digital marketing to capture the surge in online shoppers. This involved optimizing websites for mobile use, offering secure online payment options, and developing a streamlined order fulfillment system.
- Revised Store Operations: Stores were reconfigured to emphasize safety and social distancing measures. This involved redesigning store layouts, implementing contactless payment options, and providing adequate personal protective equipment for employees. In-store shopping experiences were transformed to address evolving consumer needs.
- Supply Chain Resilience: The retailer recognized the vulnerability of its supply chain and took steps to diversify its suppliers and build more resilient partnerships. This meant exploring alternative sources for goods, strengthening communication channels with suppliers, and developing contingency plans for potential disruptions.
Example of a Country’s Economic Recovery: South Korea
South Korea’s recovery from the pandemic’s economic downturn was notable for its swift and decisive actions. The government’s proactive measures, combined with the country’s robust digital infrastructure and strong technological capabilities, allowed for a rapid resurgence in economic activity.
Key Elements of South Korea’s Recovery
- Government Support Packages: South Korea implemented comprehensive financial support programs for businesses and individuals. These included loan guarantees, tax incentives, and direct payments to help mitigate the economic shock and maintain employment levels.
- Focus on Digital Transformation: The country leveraged its strong digital infrastructure to facilitate remote work and online services. This allowed businesses to adapt quickly to the changing market demands and minimize the impact of lockdowns.
- Healthcare Infrastructure: South Korea’s effective public health response, including rapid testing and contact tracing, helped to control the spread of the virus and maintain a stable social and economic environment.
Long-Term Economic Consequences
The COVID-19 pandemic’s impact extended far beyond the immediate health crisis, profoundly reshaping the global economic landscape. The crisis exposed vulnerabilities in existing systems, accelerated existing trends, and introduced new challenges that will likely influence economic trajectories for years to come. The ripple effects continue to be felt in various sectors, impacting everything from consumer behavior to government policy.The pandemic’s legacy includes not only the immediate economic downturn but also the potential for lasting damage.
This damage manifests in various forms, from increased inequality and unemployment to the long-term strain on businesses and the overall economy. The long-term economic consequences demand careful analysis and proactive strategies to mitigate the potential for lasting harm.
Impact on Labor Markets
The pandemic significantly altered labor market dynamics. Lockdowns and business closures led to widespread job losses across industries. This disruption forced many workers to re-evaluate their career paths, leading to shifts in employment sectors and potentially impacting future workforce participation rates. Furthermore, the rise of remote work challenged traditional office structures and fostered a new paradigm of employment.
The pandemic’s influence on the future of work is still unfolding, with potential long-term implications for employment patterns, skill requirements, and the overall economic structure.
Restructuring of Industries
The pandemic accelerated the digital transformation of numerous industries. E-commerce boomed, as consumers turned to online shopping and remote services. This shift created new opportunities for businesses adapting to the changing landscape. However, the pandemic also highlighted vulnerabilities in supply chains and the need for greater resilience in the face of unforeseen events. The long-term implications for industry restructuring are multifaceted, encompassing changes in production methods, supply chain diversification, and consumer preferences.
Changes in Consumer Behavior
Consumer behavior underwent significant shifts during the pandemic. Consumers prioritized essential goods and services, altering purchasing habits and impacting retail sectors. The pandemic underscored the importance of adapting to changing consumer needs and expectations, as well as the need for resilient supply chains and flexible business strategies. This shift towards prioritizing essential goods and services, and the reliance on online shopping, has the potential to permanently alter consumer preferences and demand patterns.
Government Responses and Long-Term Implications
Governments worldwide responded to the pandemic with various stimulus packages and policies aimed at mitigating economic damage. These interventions, while crucial in the short term, also had long-term implications. The increased government debt and potential inflationary pressures from stimulus spending are considerations that must be managed effectively in the long term. The potential for long-term inflationary pressures resulting from these stimulus packages will need to be monitored and addressed with appropriate policies.
Potential Long-Term Economic Trends
| Trend | Description | Potential Impact |
|---|---|---|
| Increased Digitalization | Expansion of online services, remote work, and e-commerce | Creation of new jobs, but also potential job displacement in traditional sectors. |
| Supply Chain Resilience | Focus on diversifying supply chains and reducing reliance on single sources. | Increased costs for businesses but enhanced global resilience. |
| Enhanced Healthcare Infrastructure | Prioritization of public health and healthcare systems. | Potential for higher healthcare spending and improved preparedness for future crises. |
| Shift in Consumer Preferences | Emphasis on essential goods and services, and increased reliance on digital channels. | Adaptation required for businesses to meet evolving needs. |
| Increased Government Debt | Stimulus packages and social safety nets. | Potential for increased taxation or reduced future spending to manage debt levels. |
Infographic Structure
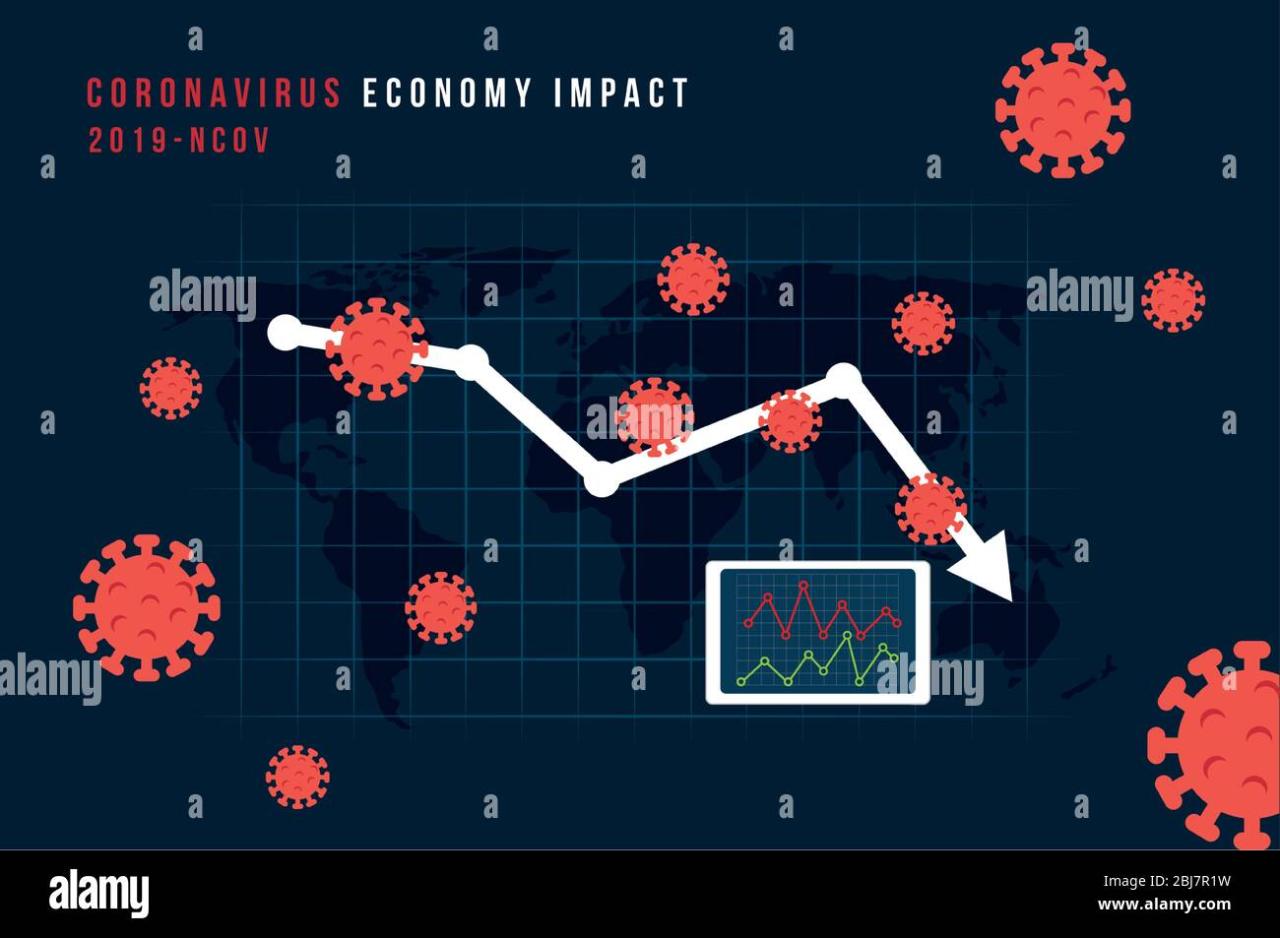
A compelling infographic is crucial for conveying the complex economic impact of the pandemic. It needs to be easily digestible, visually appealing, and accurately reflect the multifaceted nature of the crisis. This section details the structure and key elements of an effective infographic on the pandemic’s economic repercussions.The infographic should be organized to guide the viewer through the various facets of the economic impact.
By presenting information in a structured and visually engaging manner, the infographic aims to effectively communicate the scope and magnitude of the pandemic’s influence on the global economy.
Key Elements of the Infographic
The infographic should effectively communicate the economic impact of the pandemic. This involves presenting data in a digestible format that captures the essence of the crisis without overwhelming the viewer.
- Executive Summary: A concise overview of the pandemic’s economic impact, highlighting key trends and findings. This serves as an introduction to the overall theme.
- Timeline of Events: A chronological representation of key events related to the pandemic’s economic effects, such as lockdowns, economic shutdowns, and policy responses. This allows viewers to understand the sequence of events and their impact.
- Data Visualization: Presentation of crucial economic data through charts, graphs, and maps. This includes key indicators like GDP growth, unemployment rates, and consumer spending.
- Supply Chain Disruptions: Visual representation of the ripple effects of supply chain disruptions across various sectors. This can be achieved through flowcharts, maps, or network diagrams to illustrate the cascading impacts.
- Consumer Behavior Shifts: Illustrative examples of how consumer preferences changed during the pandemic, such as increased online shopping or adoption of contactless payment methods. This can be depicted through charts comparing pre- and post-pandemic consumer trends.
- Government Responses and Policies: A visual representation of various government interventions and policies, such as stimulus packages or economic aid programs. Use icons or symbols to represent different types of policies.
- Healthcare System Strain: Visualizing the economic burden on healthcare systems due to increased demand for services and medical supplies. Consider using bar graphs to display cost comparisons before and after the pandemic.
- Economic Cost: A clear representation of the overall economic cost of the pandemic, using data visualization techniques to show the impact on various economic sectors.
- Specific Sector Impacts: Visualizing the impacts on specific industries, such as travel, hospitality, retail, and manufacturing. Consider using sector-specific charts or graphs.
- Illustrative Case Studies: Inclusion of short case studies highlighting the specific impacts on particular businesses or communities. This can be presented in a visually engaging way using text boxes or panels.
- Long-Term Economic Consequences: Presenting potential long-term effects of the pandemic, such as structural changes in the economy or shifts in workforce demographics. This can be illustrated with future-oriented projections.
Data Visualization Methods
Effective data visualization is crucial for conveying complex economic data in a clear and accessible way.
- Line Graphs: Useful for displaying trends over time, such as GDP growth or unemployment rates.
- Bar Charts: Effective for comparing values across different categories, such as the economic impact on different sectors.
- Pie Charts: Useful for illustrating the proportion of different components within a whole, such as the allocation of government stimulus funds.
- Maps: Visualizing geographic variations in economic impact, such as the spread of unemployment or the effect on specific regions.
- Flowcharts: Illustrating complex relationships and cause-and-effect scenarios, such as supply chain disruptions.
- Infographics: Presenting information visually in an easily digestible format, focusing on key data points and trends.
Mock-up Infographic Layout
A suggested layout for the infographic includes a title and a brief introductory paragraph at the top, followed by various sections. Each section would contain specific visual elements like graphs, charts, maps, and icons, alongside concise explanations. Color palettes should be used effectively to highlight different aspects and themes.
Imagine a two-page layout with a visually striking header on page one. The first page would showcase a high-level overview with a summary of the economic impact, key statistics, and a timeline of events. The second page would dive deeper into specific sectors, illustrative case studies, and long-term consequences.
Visual elements like icons, graphs, and maps should be strategically placed to guide the viewer’s eye and emphasize key data points. The layout should be designed for clear navigation and readability, ensuring the infographic is accessible and impactful.
Visual Representation (Infographic)
The visual representation of the infographic is crucial for effectively communicating complex economic data about the pandemic’s impact. A well-designed infographic can break down intricate information into easily digestible chunks, making the information accessible to a broad audience. The goal is to present the data in a visually compelling and engaging manner that helps viewers understand the magnitude and scope of the economic consequences.The infographic’s design should be clear, concise, and visually appealing.
It should guide the viewer through the different facets of the economic crisis, from initial disruptions to long-term consequences. A strategic use of color, font, and layout is essential for effective communication and understanding.
Color Palette
A color palette that evokes trust and clarity is crucial. A primary color scheme, such as a muted palette of blues and greens, can represent stability and growth. Accent colors, like a vibrant orange or a deep purple, can highlight key data points or specific sectors. Using a consistent color scheme throughout the infographic ensures visual cohesion and improves readability.
Avoid overly saturated colors or jarring color combinations that might distract the viewer.
Font Selection and Sizing
Selecting appropriate fonts is essential. A clear, legible font, like Arial or Open Sans, should be used for headings and body text. Varying font sizes can emphasize important information, such as key figures or critical statistics. Font sizes should be scalable to ensure readability on different screen sizes. Consider using a hierarchy of fonts to establish visual importance.
Layout and Structure
The infographic’s layout should be logical and easy to navigate. A clear visual hierarchy should guide the viewer’s eye through the information. Use whitespace effectively to avoid clutter and ensure each section is visually distinct. Employing visual cues, like icons or symbols, can enhance comprehension and engagement. Sections should be grouped logically to improve understanding.
For example, sections on supply chain disruptions should be near sections on consumer behavior shifts.
Charts and Graphs
Charts and graphs are essential tools for presenting economic data. Bar graphs can effectively compare economic indicators across different periods or sectors. Line graphs can illustrate trends over time, such as GDP growth or unemployment rates. Pie charts can show the breakdown of specific economic sectors or components. The choice of chart type should be tailored to the specific data being presented.
For instance, a bar graph is best for comparing the revenue of different sectors, whereas a line graph is best for illustrating the trajectory of GDP growth over time. Ensure all charts are properly labeled with clear axis titles and legends.
Potential Infographic Image Description
The infographic is presented as a large, visually engaging graphic, resembling a stylized map of the world, divided into regions. Each region is a different shade of a muted blue, transitioning to a slightly lighter shade toward the center. The infographic focuses on the pandemic’s economic impacts, showing the severity of the crisis across various sectors. Each region is further divided into smaller sections, highlighting specific economic indicators, such as GDP growth, unemployment rates, and consumer spending.Within each section, data is presented using a combination of bar graphs and line graphs.
The graphs are clearly labeled, with concise axis titles and legends. The data displayed reflects the economic impact of the pandemic in different regions, with key figures highlighted in a bold, contrasting color. Subtle animations or transitions between sections can be included to enhance the visual appeal and engagement. Icons or symbols representing specific sectors, such as travel, retail, or hospitality, are strategically placed within the regions.
Closing Notes
In conclusion, the coronavirus pandemic infected the economy infographic paints a stark but informative picture of the economic turmoil caused by the global health crisis. The infographic demonstrates the multifaceted impact, from immediate disruptions to long-term consequences. By examining supply chain disruptions, consumer behavior shifts, and government responses, we gain a deeper understanding of the economic repercussions of the pandemic.
Hopefully, this visual representation will help us learn from the past and be better prepared for future crises.
