
Inventory Calculations in Microsoft Excel A Complete Guide
Inventory calculations in Microsoft Excel are crucial for any business. This guide dives deep into the world of inventory management, covering everything from basic tracking to advanced techniques. Learn how to use Excel formulas, create insightful reports, and implement best practices for maintaining accurate inventory records.
From understanding different inventory systems like FIFO and LIFO to calculating crucial metrics like inventory turnover and carrying costs, this comprehensive guide empowers you to master inventory management in Excel. We’ll also explore advanced Excel features like VLOOKUP, INDEX & MATCH, PivotTables, and conditional formatting to streamline your inventory tracking and analysis.
Introduction to Inventory Calculations
Inventory calculations are crucial for any business dealing with physical goods. They provide a snapshot of the company’s stock levels, allowing for informed decisions regarding purchasing, pricing, and overall operational efficiency. Accurate calculations are vital for maintaining profitability, minimizing storage costs, and preventing stockouts or overstocking. A well-managed inventory system ensures smooth operations and customer satisfaction.Accurate inventory calculations are essential for businesses to track their stock levels effectively.
This helps to optimize their purchasing strategies, manage storage costs, and prevent stockouts or overstocking. It enables businesses to make informed decisions regarding pricing and production, ultimately boosting profitability.
Inventory Calculation Methods
Inventory calculation methods are procedures used to determine the value of inventory. Different methods offer varying results, impacting the financial statements. Understanding the different methods is key to choosing the most appropriate approach for a specific business.
- First-In, First-Out (FIFO): This method assumes that the first items purchased are the first items sold. This method is often preferred for perishable goods, as it reflects the most current costs. Under FIFO, the cost of goods sold (COGS) is calculated using the oldest inventory costs, leaving the newer, potentially higher, costs in the inventory valuation.
- Last-In, First-Out (LIFO): LIFO assumes the last items purchased are the first items sold. This method can be advantageous during periods of inflation, as it results in a higher COGS and lower ending inventory valuation. However, the IRS does not allow the use of LIFO for inventory valuation in many countries. This method might not accurately reflect the current market value of inventory.
- Weighted-Average Cost: This method calculates the average cost of all inventory items. The average cost is then used to determine the value of goods sold and the value of ending inventory. This approach smooths out fluctuations in cost, providing a more stable valuation, especially in industries with fluctuating material prices.
Inventory Calculation Metrics
These metrics provide insights into the efficiency and effectiveness of inventory management.
- Inventory Turnover: This metric measures how many times a company sells and replaces its inventory during a specific period (e.g., a year). A higher inventory turnover generally indicates efficient inventory management. A formula for inventory turnover is: Cost of Goods Sold / Average Inventory. A high turnover ratio might signal a need to analyze if the business is selling products quickly enough, or if it is being overly aggressive with ordering.
A low turnover ratio could suggest that the company is overstocking or that its pricing is too high.
- Carrying Costs: These costs represent the expenses associated with holding inventory, including storage, insurance, taxes, and obsolescence. Effective inventory management aims to minimize carrying costs. Examples of carrying costs include warehouse space, security, and insurance premiums, which add to the total inventory costs.
Excel Template for Inventory Tracking
A well-structured spreadsheet is essential for efficient inventory management. The following template provides a basic structure for tracking inventory data.
| Date | Item | Quantity | Cost |
|---|---|---|---|
| 2024-07-27 | Widget A | 100 | $5.00 |
| 2024-07-27 | Widget B | 50 | $10.00 |
| 2024-07-28 | Widget A | 50 | $5.25 |
This table demonstrates a simple inventory tracking spreadsheet, with columns for date, item, quantity, and cost. This template allows for easy data entry and analysis. This is a very basic example, and a more robust template might include additional columns, such as supplier, location, and reorder point.
Excel Formulas for Inventory Calculations
Mastering inventory management in Excel involves leveraging powerful formulas to track, analyze, and optimize your stock. This section dives deep into the formulas essential for calculating total inventory value, turnover rates, carrying costs, and implementing different inventory costing methods. We’ll also explore how to set up alerts for low stock levels using IF statements.Effective inventory management relies on accurate calculations.
These formulas are crucial for making informed decisions about purchasing, storage, and pricing strategies, ultimately maximizing profitability and minimizing waste.
Calculating Total Inventory Value
To determine the total value of your inventory, you need to multiply the quantity of each item by its respective unit price. Excel provides a straightforward method for this. For example, if you have a list of items with their quantities and unit prices in columns B and C, respectively, you can use the following formula in a new column (e.g., column D):
=B2*C2
This formula multiplies the quantity in cell B2 by the unit price in cell C2. You can then drag this formula down to apply it to all rows of your inventory data. To sum the total inventory value, use the SUM function.
=SUM(D2:D10)
This will add up all the values in column D, giving you the total inventory value.
Using SUM, AVERAGE, and COUNT Functions
These functions are fundamental for analyzing inventory data. The SUM function, as previously mentioned, is crucial for totaling inventory values, calculating total costs, and summarizing various metrics. The AVERAGE function can calculate the average inventory level, cost per unit, or other relevant averages. The COUNT function is essential for determining the number of items in stock or the number of transactions.
These functions can be combined with other formulas to gain deeper insights into inventory trends.
Calculating Inventory Turnover Rate
The inventory turnover rate measures how efficiently a company is managing its inventory. It shows how many times a company sells and replaces its inventory over a period (usually a year). A higher turnover rate generally indicates better efficiency.
= (Cost of Goods Sold) / ((Beginning Inventory + Ending Inventory) / 2)
In Excel, you would replace the elements in the formula with their corresponding cell references. For example, if the Cost of Goods Sold is in cell E2, Beginning Inventory is in F2, and Ending Inventory is in G2, the formula would be:
=E2 / ((F2 + G2) / 2)
Calculating Carrying Cost Per Unit
Carrying cost per unit encompasses all the costs associated with holding inventory. This includes storage, insurance, taxes, obsolescence, and more. It is crucial for understanding the financial implications of holding inventory.
= (Total Carrying Costs) / (Total Units in Inventory)
For instance, if your total carrying costs are in cell H2 and your total units in inventory are in I2, the formula would be:
=H2 / I2
Comparing Inventory Costing Methods
The following table demonstrates how different inventory costing methods (FIFO, LIFO, weighted average) impact inventory valuation and cost of goods sold calculations in Excel. These methods reflect different assumptions about the flow of costs.
| Method | Calculation (Example) | Ending Inventory Value | Cost of Goods Sold |
|---|---|---|---|
| FIFO (First-In, First-Out) | Assumes the first items purchased are the first ones sold. | Value of most recently purchased items. | Value of earliest purchased items. |
| LIFO (Last-In, First-Out) | Assumes the last items purchased are the first ones sold. | Value of earliest purchased items. | Value of most recently purchased items. |
| Weighted Average | Calculates the average cost of all inventory items. | Average cost multiplied by ending inventory quantity. | Average cost multiplied by the number of units sold. |
Calculating Ending Inventory Value
The value of ending inventory depends on the costing method used. Excel formulas can calculate this value based on the chosen method. For instance, using the weighted average method, if the average cost per unit is in cell J2 and the ending inventory quantity is in K2, the formula is:
=J2*K2
Low Stock Alerts Using IF Statements
To proactively manage inventory levels, you can use IF statements to create alerts for low stock levels. This helps avoid stockouts and allows for timely reordering. This example assumes that column L contains the current inventory level and column M contains the reorder point.
| Formula | Description |
|---|---|
| =IF(L2<M2,"Low Stock Alert","OK") | If the inventory level in cell L2 is below the reorder point in cell M2, it displays “Low Stock Alert”; otherwise, it displays “OK”. |
This formula can be dragged down to apply to all items in your inventory.
Obtain recommendations related to cima ethics confidentiality rules that can assist you today.
Advanced Excel Techniques for Inventory Management
Mastering inventory management in Excel goes beyond basic calculations. Advanced techniques unlock deeper insights and automate tasks, streamlining your inventory processes. These techniques enable efficient data analysis, trend identification, and automated calculations, leading to better decision-making.Leveraging advanced Excel functions and features allows for more sophisticated inventory management. From identifying specific item details to predicting future needs, these methods offer a powerful toolkit for inventory optimization.
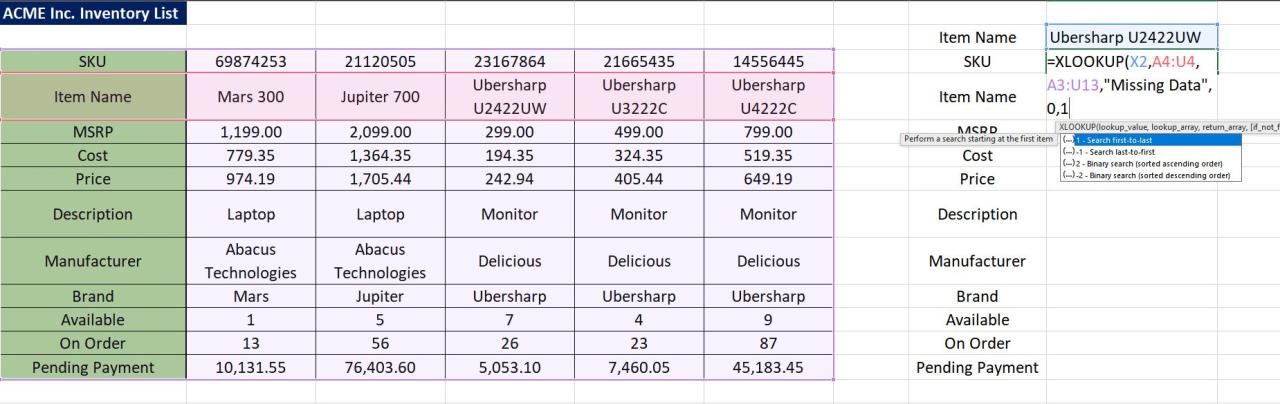
Using VLOOKUP for Specific Inventory Item Data
VLOOKUP is a fundamental tool for retrieving specific inventory item information quickly. It searches for a value in a specific column of a table and returns a corresponding value from another column in the same row. This is invaluable for retrieving details like price, quantity, or supplier information based on item codes.
- Efficiently look up item details like price, quantity, and supplier based on item code.
- The syntax for VLOOKUP is: `=VLOOKUP(lookup_value, table_array, col_index_num, [range_lookup])`.
- Example: To find the price of item “ABC123”, use `=VLOOKUP(“ABC123”, A1:C10, 3, FALSE)` where column A contains item codes, column B contains descriptions, and column C contains prices. The `FALSE` ensures an exact match.
Using INDEX and MATCH Functions for Complex Lookups
INDEX and MATCH functions provide a more flexible approach for complex lookups than VLOOKUP. INDEX returns a value from a specific cell or range, and MATCH finds the position of a value within a range. This combination allows for searching multiple criteria, enabling more precise and detailed information retrieval.
- Retrieving data based on multiple criteria, surpassing VLOOKUP’s limitations.
- The syntax for INDEX and MATCH is: `=INDEX(array,MATCH(lookup_value,lookup_array, [match_type]))`.
- Example: To find the quantity of item “XYZ456” with a specific supplier “Supplier A”, use `=INDEX(D1:D10,MATCH(1,(A1:A10=”XYZ456″)*(B1:B10=”Supplier A”),0))` where column A contains item codes, column B contains suppliers, and column D contains quantities.
Using PivotTables for Analyzing Inventory Trends Over Time
PivotTables offer a powerful way to analyze inventory trends over time. By summarizing data from multiple sources, PivotTables reveal patterns in sales, stock levels, and other key metrics. This enables insights into seasonal variations, popular items, and potential stock issues.
- Analyzing inventory trends, identifying seasonal variations, and recognizing popular items.
- PivotTables allow you to group data by date, item, or other criteria, enabling easy analysis of inventory trends.
- Example: Create a PivotTable from an inventory data table that includes date, item code, and quantity. Group by date and item to see trends.
Using Conditional Formatting for Highlighting Inventory Issues
Conditional formatting is crucial for highlighting important data points. By setting rules to format cells based on conditions, you can quickly identify low stock levels or high-value items. This helps in proactive inventory management.
- Quickly identify low stock levels and high-value items.
- Highlight cells with low stock or high value by setting rules based on specific criteria, like stock levels below a certain threshold or prices above a certain amount.
- Example: Highlight items with quantities below 10 in yellow, and items with prices above $100 in red.
Using Data Validation to Ensure Data Integrity
Data validation ensures data accuracy and consistency. By setting rules for input values, you prevent errors and maintain data integrity. This reduces the likelihood of incorrect inventory data.
- Preventing errors and maintaining data accuracy in inventory tracking.
- Data validation helps to ensure data consistency and accuracy by enforcing predefined rules for input values.
- Example: Restrict input in the “Quantity” column to positive whole numbers.
Using Macros for Automating Inventory Calculations
Macros automate repetitive tasks, saving time and reducing errors. They can be programmed to perform calculations, update data, or generate reports, significantly increasing efficiency.
- Automating repetitive tasks and reducing errors.
- Macros streamline inventory management by automating tasks like updating stock levels or generating reports.
- Example: A macro to automatically calculate the reorder point for each item based on sales history.
Using User-Defined Functions for Specific Inventory Calculations
User-defined functions (UDFs) extend Excel’s functionality. They are custom functions written in VBA (Visual Basic for Applications) that can perform complex calculations tailored to specific inventory needs.
Finish your research with information from how to clearly communicate feedback and expectations.
- Extending Excel’s capabilities for specific inventory calculations.
- UDFs enable the creation of functions to perform complex inventory calculations, like calculating the cost of goods sold.
- Example: A UDF to calculate the total value of inventory based on current prices and quantities.
Scenario-Based Inventory Calculations
Inventory management in a multi-location business requires sophisticated calculations to track and value stock accurately. Effective inventory control is crucial for optimizing operational efficiency, ensuring product availability, and maintaining profitability. This section delves into practical scenarios, demonstrating how to apply Excel formulas and techniques to calculate inventory across multiple locations, accounting for various pricing models and potential issues like damage or obsolescence.
Calculating Total Inventory Across Locations
Accurate inventory tracking across multiple locations is essential for a holistic view of the company’s stock. This requires aggregating data from different warehouse or retail locations. A combined inventory figure provides a clear picture of the total available stock, aiding in better forecasting and order fulfillment.
| Location | Product ID | Quantity |
|---|---|---|
| Warehouse A | 123 | 100 |
| Warehouse B | 123 | 150 |
| Retail Store 1 | 123 | 75 |
To calculate the total inventory of product 123, you would sum the quantities across all locations. This example shows a straightforward method, easily adaptable to larger datasets. Excel’s SUM function is the tool to efficiently consolidate data.
Inventory Valuation at Different Pricing Points
Businesses often need to calculate inventory value using different pricing methods, such as cost, retail, or standard cost. These methods impact the financial reporting and decision-making processes.
- Cost-based valuation: This approach calculates inventory value based on the actual cost of acquiring the goods. It’s a common method used for financial reporting and tax purposes. The calculation is straightforward: cost per unit multiplied by the quantity.
- Retail-based valuation: This method values inventory based on the selling price. Retail pricing is influenced by market conditions and can vary over time.
- Standard cost valuation: This approach sets a predetermined cost for each product based on historical data, standard material costs, and manufacturing processes. It simplifies valuation, particularly when dealing with a large number of products and complex production processes.
Excel formulas, like VLOOKUP, can help link product information with different pricing levels, enabling accurate calculations based on selected pricing methods.
Tracking Inventory Costs Over Time
Monitoring inventory costs over time is critical for analyzing trends, managing expenses, and optimizing inventory policies. A time-based approach is vital for identifying patterns in consumption, pricing fluctuations, and demand changes.
- Data Collection: Collect data on the quantity and cost of inventory purchased or received for each period. This historical data is essential for the analysis.
- Cost Analysis: Using Excel, create a table or chart to visualize inventory costs over time. This visualization facilitates trend analysis and the identification of cost fluctuations.
Accounting for Variations in Pricing Due to Sales Discounts or Promotions
Sales discounts and promotions are common business practices that significantly impact inventory valuation. Discounts affect the cost per unit and must be accounted for to avoid inaccuracies in inventory valuation.
- Data Entry: Ensure accurate recording of discount percentages or amounts for each product. This requires a meticulous approach to data collection.
- Calculation Adjustments: Modify the cost per unit to reflect the discounted price when calculating the total inventory value. This requires modifying the formula used in inventory calculations.
Damaged or Obsolete Inventory
Damaged or obsolete inventory presents a unique challenge to inventory management. This involves recognizing the loss of value and adjusting inventory accordingly.
- Valuation Adjustment: Inventory that is damaged or obsolete must be written down to its net realizable value. This means reducing the inventory value to the amount that can be recovered.
- Accounting Treatment: Damaged or obsolete inventory requires a specific accounting treatment, typically through a write-down. This process needs to be carefully documented and justified for reporting purposes.
Calculating Cost of Goods Sold (COGS)
COGS represents the direct costs associated with producing the goods sold. Accurately calculating COGS is essential for determining profitability.
COGS = Beginning Inventory + Purchases – Ending Inventory
Excel’s formulas and functions can easily determine the COGS for a specific period. This requires carefully tracking beginning and ending inventory values, purchases made, and associated costs.
Error Handling and Troubleshooting
Inventory calculations, while crucial, are susceptible to errors. These errors can stem from simple data entry mistakes to complex formula issues within your Excel spreadsheet. Thorough error handling and troubleshooting are essential to maintain the accuracy and reliability of your inventory management system. Understanding how to identify, verify, and resolve these issues ensures data integrity and prevents costly mistakes.
Potential Errors in Inventory Calculations
Data entry errors are a common source of inaccuracy in inventory calculations. Typos, incorrect units of measurement, and missing data can all lead to significant discrepancies. For instance, entering 100 units instead of 1000 can dramatically affect your inventory valuation and subsequent reports. Furthermore, inconsistent data formats (e.g., different ways of representing dates or currencies) can cause unexpected results.
Inaccurate or incomplete information from external sources, like supplier data feeds, can also contribute to calculation errors. These errors can have a cascading effect on downstream calculations, leading to further inaccuracies.
Methods for Verifying Calculation Accuracy, Inventory calculations in microsoft excel
Several methods can be used to verify the accuracy of inventory calculations. First, perform manual checks on a sample of calculations to identify any discrepancies. Compare these manual results with the automated calculations from Excel to ensure consistency. Secondly, employ built-in Excel functions like `SUM`, `AVERAGE`, and `COUNT` to cross-check calculations and identify potential errors. By comparing results from these functions with manually calculated results, you can identify potential errors.
Furthermore, implementing a second, independent calculation method, like a different formula or a separate spreadsheet, can act as a validation check.
Troubleshooting Common Excel Errors
Excel errors related to inventory formulas can range from #VALUE! errors to #REF! errors. The #VALUE! error typically arises when a formula encounters data that it cannot process. For example, if a cell containing a date is used in a formula expecting a number, a #VALUE! error will result. The #REF! error signifies a problem with a referenced cell or range.
This often happens when a cell that the formula references is deleted or moved, or if there are circular references in the formula. Carefully review formulas for correct cell references and ensure data integrity. Understanding these errors and their causes allows for targeted troubleshooting.
Tips for Avoiding Calculation Errors
Consistent data entry practices are crucial to minimizing errors. Establish clear guidelines for data entry, including formats, units, and acceptable values. Utilize data validation features in Excel to restrict user input, ensuring only valid data is entered. For example, you can define data validation rules that only allow numeric input for quantities or specific date formats. This prevents invalid data from entering the spreadsheet and causing calculation errors.
Discover the crucial elements that make finance departments evolving while bracing for coronavirus second wave the top choice.
Regular data checks and audits can identify and correct errors before they impact downstream calculations.
Methods for Validating Data Entry
Data validation tools in Excel are powerful for preventing errors. These tools can enforce specific data types (e.g., numbers, dates), ranges, and lists. For instance, you can require quantities to be positive numbers, preventing negative inventory levels from being entered. Use drop-down lists for categorical data (e.g., product types) to ensure consistent data entry. Employ data validation to control the format and content of data entered into your spreadsheet.
Tracing Errors in Formulas
Tracing errors in formulas involves carefully examining the formula structure and the cells it references. Break down complex formulas into smaller parts, checking each part for errors. Use the “Evaluate Formula” feature in Excel to step through the calculation process, observing how each part of the formula is evaluated. This process allows for a clear understanding of the formula’s operation and helps to pinpoint the specific point of error.
By carefully analyzing the formula’s structure and cell references, you can identify the root cause of the error and implement the necessary corrections.
Inventory Management Best Practices: Inventory Calculations In Microsoft Excel
Optimizing inventory management is crucial for profitability and efficiency. Effective strategies ensure accurate data, timely order fulfillment, and minimized storage costs. This section details best practices for organizing inventory data in Excel, maintaining data integrity, and creating a robust inventory management system. Proper tracking and reporting are also discussed, along with data integration and backup strategies.
Organizing Inventory Data in Excel
A well-structured inventory spreadsheet is the foundation of a successful inventory management system. Columns should clearly define each item, including product ID, description, quantity, unit cost, location, and supplier. Use descriptive names for columns to enhance readability and avoid ambiguity. Data validation rules (e.g., restricting input to specific categories) can prevent errors and ensure data consistency. Consider using a separate sheet for inventory transactions, recording each purchase, sale, or adjustment.
This separation facilitates analysis and audit trails.
Maintaining Data Integrity in Inventory Spreadsheets
Data integrity is paramount for accurate inventory calculations and reporting. Implement data validation rules to ensure that only appropriate data types and values are entered. Use drop-down lists for categorical data (e.g., product categories) to avoid typos and maintain consistency. Regularly review and validate data entries to identify and correct errors promptly. Consider using formulas for automatic calculations, such as total value, to minimize manual errors and ensure accuracy.
Creating a Comprehensive Inventory Management System in Excel
A comprehensive system goes beyond basic tracking. It should include features for forecasting demand, managing reorder points, and generating reports. Develop a system for tracking inventory movements, with separate columns for purchase dates, supplier details, and transaction types (e.g., purchase, sale, adjustment). Consider using color-coding or conditional formatting to highlight low stock levels or items approaching their reorder point.
Integrate a system for tracking expiry dates for perishable goods.
Inventory Tracking Strategies
Effective tracking strategies are crucial for maintaining accurate inventory levels. A combination of methods ensures comprehensive coverage.
- First-In, First-Out (FIFO): This method assumes the oldest inventory is sold first, aligning with the typical flow of goods. This method is crucial for products with expiry dates or those that might lose value over time.
- Last-In, First-Out (LIFO): This method assumes the most recently added inventory is sold first, which can be helpful in specific tax scenarios. However, its application is less common in everyday inventory management.
- Average Cost Method: This method calculates the average cost of all inventory items and applies that average to each sale. It’s a simpler approach that avoids the complexities of FIFO or LIFO.
Creating Reports and Visualizations to Track Inventory
Regular reporting is essential for monitoring inventory levels and identifying trends. Generate reports on low stock items, stock turnover rates, and the value of current inventory. Visualizations like bar charts or pie charts can effectively communicate inventory data, enabling quick identification of key trends.
Integrating Inventory Data with Other Business Systems
Integrating inventory data with other business systems enhances efficiency. Connect inventory tracking with sales data to automate calculations and reports. Automate purchase orders based on low stock levels, ensuring timely replenishment.
Best Practices for Data Backups and Disaster Recovery for Inventory Data
Regular data backups are essential to protect against data loss. Implement a backup schedule, storing copies offsite. Develop a disaster recovery plan outlining steps to restore data in case of a system failure. Consider cloud-based storage solutions for enhanced security and accessibility.
Ending Remarks
This in-depth exploration of inventory calculations in Excel has provided a robust toolkit for effective inventory management. By understanding the formulas, techniques, and best practices Artikeld, you can significantly improve your business’s inventory control, reduce errors, and gain valuable insights into your inventory performance. From basic spreadsheet templates to advanced analysis, this guide equips you to manage your inventory effectively and make data-driven decisions.