Finance Sector Climate Related Risks Guide Navigating the Future
Finance sector climate related risks guide provides a comprehensive overview of the challenges and opportunities presented by climate change in the financial sector. This guide explores the diverse range of climate-related financial risks, from physical impacts like extreme weather events to transition risks associated with the shift to a low-carbon economy. Understanding these risks is crucial for financial institutions, investors, and policymakers alike, as they can significantly impact financial stability and the broader economy.
The guide delves into methods for assessing and measuring these risks, offering practical strategies for mitigation and resilience building. It also highlights the importance of transparency and disclosure in reporting climate-related risks, drawing on global standards and best practices. Ultimately, this guide aims to equip readers with the knowledge and tools to navigate the complex landscape of climate-related financial risks and contribute to a more sustainable future.
Introduction to Climate-Related Financial Risks
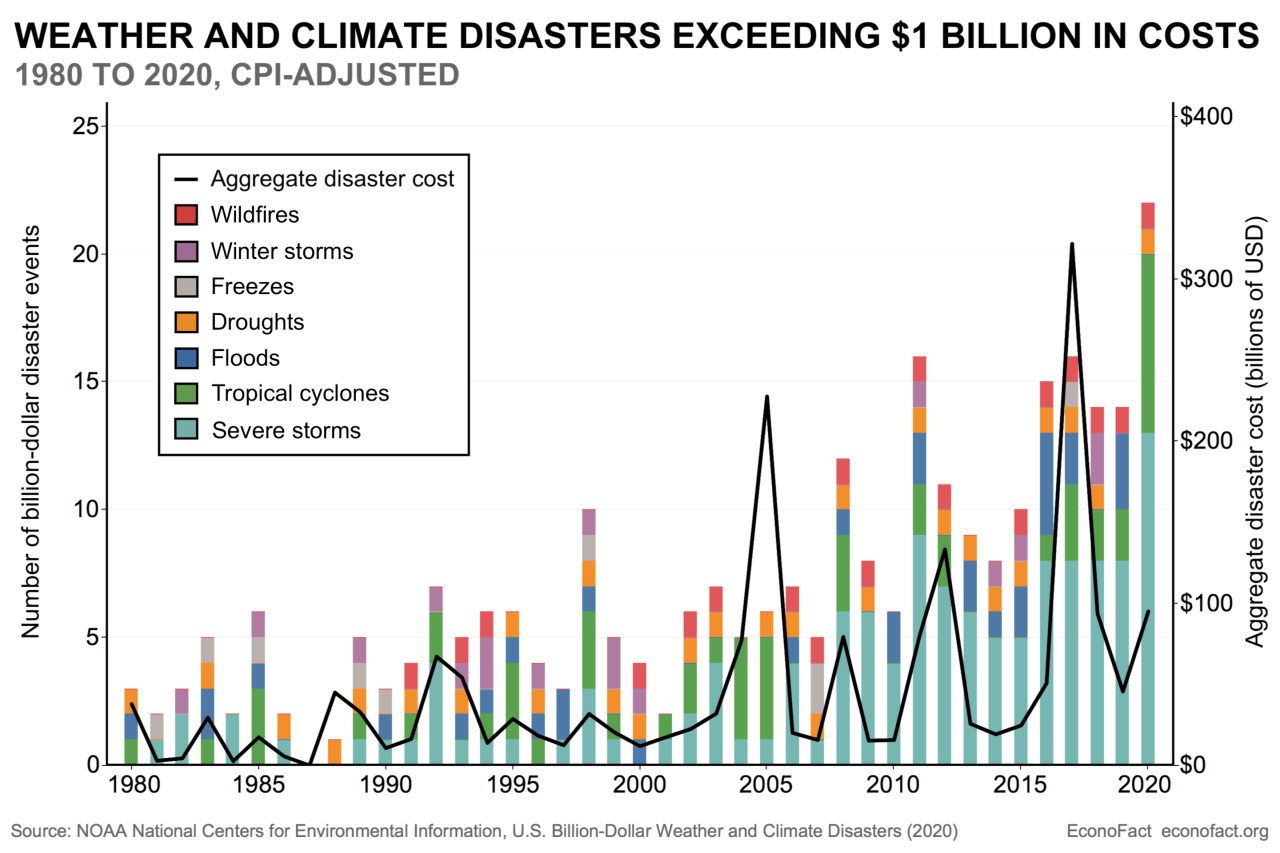
Climate change poses a significant threat to the global financial system. Financial institutions are increasingly exposed to risks stemming from the physical impacts of climate change, such as extreme weather events, and the transition to a low-carbon economy. Understanding these risks is crucial for effective risk management and the long-term sustainability of the financial sector.The financial sector’s exposure to climate-related risks is multifaceted and encompasses a wide range of potential impacts.
From extreme weather events disrupting supply chains and causing property damage to the shift away from fossil fuels impacting investments in traditional energy sectors, the consequences are far-reaching and interconnected. Recognizing and mitigating these risks is not just a matter of environmental responsibility; it’s a critical element of sound financial management.
Definition of Climate-Related Financial Risks
Climate-related financial risks are those financial risks stemming from the physical impacts of climate change (e.g., extreme weather events) and the transition to a low-carbon economy (e.g., policy changes, technological advancements). These risks affect financial institutions’ assets, liabilities, and operations.
Types of Climate-Related Financial Risks
Climate-related risks can be broadly categorized into two main types: physical risks and transition risks.
- Physical Risks: These risks arise from the physical impacts of climate change, such as rising sea levels, more frequent and intense extreme weather events, and changing temperature patterns. These events can directly damage physical assets, disrupt operations, and lead to increased insurance claims, impacting profitability and financial stability.
- Transition Risks: These risks are associated with the transition to a low-carbon economy. Policy changes, technological advancements, and shifts in consumer preferences are driving a global transition away from fossil fuels. This transition can impact investments in traditional energy sectors, leading to stranded assets and financial losses for companies and investors dependent on those sectors. Examples include investments in coal mines facing regulatory hurdles or energy companies struggling to adapt to new energy standards.
Potential Impacts on Financial Institutions and Stakeholders
Climate-related financial risks can significantly impact financial institutions and their stakeholders in various ways. For example, a major flood event could lead to significant losses for insurers, impacting their solvency and potentially leading to higher premiums for policyholders. Transition risks can also impact institutional investors holding significant stakes in carbon-intensive industries. These disruptions can affect asset values, profitability, and investor confidence.
Moreover, the reputational damage from inaction on climate change can severely harm the image and trust of financial institutions.
Key Players and Roles in Addressing Climate-Related Financial Risks, Finance sector climate related risks guide
The successful management of climate-related financial risks requires collaboration among various stakeholders. This table Artikels the key players and their roles in this process.
| Key Player | Role |
|---|---|
| Financial Institutions | Assess and manage climate-related risks within their portfolios and operations, develop climate-related disclosures, and invest in sustainable solutions. |
| Regulators | Develop and enforce regulations to encourage climate-risk assessment and disclosure, promote sustainable finance, and ensure financial stability. |
| Investors | Integrate climate considerations into investment decisions, demand transparency from companies on climate risks, and support sustainable business models. |
| Companies | Assess their climate-related risks and vulnerabilities, develop strategies to mitigate these risks, and disclose their climate performance. |
| Governments | Implement policies to encourage the transition to a low-carbon economy, support the development of sustainable infrastructure, and provide incentives for climate-friendly investments. |
Assessing and Measuring Climate Risks
Unveiling the financial impact of climate change requires robust assessment and measurement methodologies. Ignoring these risks can lead to significant financial losses and operational disruptions for the finance sector. This section delves into various approaches for evaluating and quantifying climate-related risks, highlighting the challenges and providing practical examples.
Check cima ethics confidentiality rules to inspect complete evaluations and testimonials from users.
Methods for Assessing Financial Impact
Various methods exist for assessing the financial impact of climate change on the finance sector. These methods range from simple scenario analysis to complex integrated assessment models. Each method has strengths and weaknesses, and the optimal approach depends on the specific risk being assessed and the available data. Key methods include:
- Financial Stress Testing: This method involves simulating potential climate-related events, such as extreme weather or policy changes, and evaluating their impact on financial institutions’ portfolios and profitability. Stress tests typically use historical data and expert judgment to project future scenarios. For instance, a bank might simulate a severe drought affecting agricultural loans to estimate potential losses.
- Scenario Analysis: This involves examining different potential future climate scenarios and their implications for financial assets and liabilities. The scenarios can vary in severity and probability, enabling a comprehensive understanding of the range of potential impacts. Examples include assessing the impact of rising sea levels on coastal real estate portfolios.
- Climate-Related Risk Models: These models use statistical and econometric techniques to predict the likelihood and severity of climate-related events. They integrate climate data, economic factors, and financial variables to assess potential risks. These models can incorporate factors like extreme weather events, changing agricultural yields, or shifting energy demand patterns.
Challenges in Measuring and Quantifying Risks
Accurately measuring and quantifying climate-related financial risks presents significant challenges. These challenges stem from the complex interplay of climate, economic, and financial variables. Key challenges include:
- Data Availability and Quality: Reliable and comprehensive data on climate-related events, their financial impacts, and future projections is often limited or of varying quality. This poses a significant hurdle in developing accurate models and assessments.
- Defining the Scope of Risks: Climate change impacts extend across various sectors and asset classes, making it difficult to precisely define the scope of financial risks and isolate the effects of climate change from other factors.
- Long-Term Time Horizons: The impacts of climate change often manifest over long time horizons, making it difficult to project future financial implications and to appropriately discount them. This is crucial when considering the potential for significant shifts in investment value over decades.
Approaches to Modeling Climate-Related Risks
Several approaches are used to model climate-related risks. These approaches vary in complexity and the level of detail they provide.
- Physical Climate Impacts: Models focusing on physical impacts use climate data, such as temperature changes, precipitation patterns, and sea-level rise, to assess the potential damages to physical assets. These models might assess the potential for increased flooding or extreme heat events on a portfolio of buildings or infrastructure.
- Transition Risks: Models assessing transition risks focus on the potential financial implications of the shift towards a low-carbon economy. These models consider factors such as regulatory changes, technological advancements, and market shifts. Examples include the potential for stranded assets in fossil fuel companies due to a rapid shift to renewable energy.
- Integrated Assessment Models: These models integrate physical climate impacts, transition risks, and financial variables to create a comprehensive picture of potential climate-related financial risks. They offer a more holistic approach by linking climate variables to economic activity and financial markets. These models can assess the interconnectedness of climate change and financial markets.
Data Sources for Evaluating Climate Risks
A variety of data sources are employed to evaluate climate risks. These sources provide the necessary information to support the models and analyses.
- Historical Climate Data: Historical temperature, precipitation, and extreme weather event data are crucial for understanding past trends and potential future patterns.
- Economic and Financial Data: Data on asset values, market trends, and economic indicators are vital for assessing the financial implications of climate change.
- Expert Knowledge and Projections: Expert opinions and projections from various scientific and economic disciplines provide crucial insights into future climate scenarios and their potential impacts.
Comparison of Risk Assessment Methodologies
| Methodology | Strengths | Weaknesses |
|---|---|---|
| Scenario Analysis | Simple to implement, provides a range of potential outcomes. | Relies heavily on assumptions, may not capture all complexities. |
| Financial Stress Testing | Provides a quantitative assessment of potential losses. | Limited scope, often focused on specific institutions. |
| Climate-Related Risk Models | Can integrate various factors, provide detailed analysis. | Requires significant data and expertise, complex to implement. |
Developing Strategies to Mitigate Risks
Navigating the financial implications of climate change requires proactive strategies. Financial institutions are increasingly recognizing the need to incorporate climate-related risks into their decision-making processes, moving beyond mere compliance to a holistic approach. This involves not just identifying the threats but also actively developing strategies to mitigate their potential damage.
Strategies for Mitigating Financial Impacts
Financial institutions can employ a variety of strategies to mitigate the financial impacts of climate change. These range from portfolio diversification to incorporating climate-related factors into investment analysis and risk assessments. A key aspect is understanding the specific vulnerabilities within their portfolios and tailoring strategies to address those vulnerabilities.
Role of Regulatory Frameworks
Robust regulatory frameworks play a crucial role in managing climate-related financial risks. These frameworks can provide a standardized approach to risk assessment, disclosure, and mitigation, fostering a level playing field and promoting transparency. Clear guidelines on climate-related disclosures encourage consistent reporting and facilitate better risk management practices. Regulatory oversight also helps prevent the spread of misleading or incomplete information, allowing investors and stakeholders to make informed decisions.
Importance of Scenario Planning
Scenario planning is critical in assessing and mitigating climate-related risks. It involves considering a range of potential future climate scenarios, from moderate warming to more extreme warming scenarios, and evaluating the financial implications of each. This allows institutions to anticipate and prepare for a wider spectrum of potential outcomes, rather than relying on a single, potentially overly optimistic, future projection.
It helps develop more robust and adaptable strategies.
Examples of Climate-Related Risk Mitigation Strategies
Many financial institutions are already implementing various strategies to mitigate climate-related risks. For example, some are divesting from fossil fuel companies, while others are incorporating climate-related factors into their investment decisions. Others are developing new financing mechanisms to support the transition to a low-carbon economy. These examples showcase the growing recognition of the importance of climate change considerations within the financial sector.
Table of Climate Risk Mitigation Strategies and Effectiveness
| Mitigation Strategy | Description | Effectiveness (Qualitative Assessment) |
|---|---|---|
| Portfolio Diversification | Reducing reliance on sectors vulnerable to climate change by diversifying investments across different sectors and geographies. | High – Diversification reduces overall risk, but specific vulnerabilities remain. |
| Climate-Related Risk Assessments | Incorporating climate change considerations into traditional financial risk assessments, such as credit and market risk assessments. | Medium to High – Improves risk identification but requires consistent data and expertise. |
| Investment in Green Technologies | Investing in companies developing and deploying technologies that mitigate climate change. | High – Supports the transition to a low-carbon economy and can create new investment opportunities. |
| Transition Planning | Developing strategies to manage the financial implications of the transition to a low-carbon economy. | High – Essential for long-term financial stability, but requires ongoing adaptation. |
Disclosure and Transparency: Finance Sector Climate Related Risks Guide
Transparency in reporting climate-related risks is crucial for investors, lenders, and other stakeholders to make informed decisions. Open communication about potential financial impacts of climate change fosters trust and enables proactive risk management. This section delves into the importance of transparent reporting, global standards, and best practices.
Importance of Transparency in Reporting
Climate-related financial risks are complex and interconnected. Full disclosure allows stakeholders to assess the potential impact of climate change on an organization’s financial performance, enabling them to make more informed investment decisions. This transparency also fosters accountability, encouraging organizations to adopt effective risk mitigation strategies. Moreover, it helps to build trust with investors, who are increasingly demanding climate-related disclosures.
Global Standards and Frameworks for Disclosure
Numerous global standards and frameworks guide the disclosure of climate-related financial risks. The most prominent is the Task Force on Climate-related Financial Disclosures (TCFD). The TCFD framework provides a consistent structure for companies to disclose climate-related risks and opportunities, fostering greater comparability across organizations. Other notable frameworks include the Sustainability Accounting Standards Board (SASB) and the Global Reporting Initiative (GRI).
TCFD Framework: A Detailed Overview
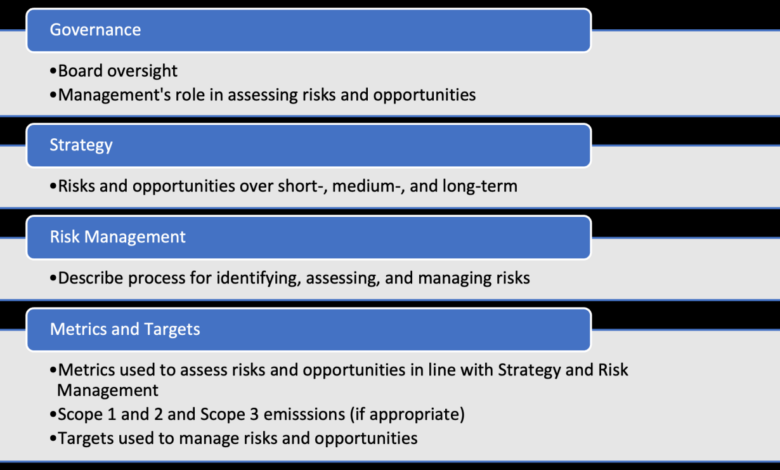
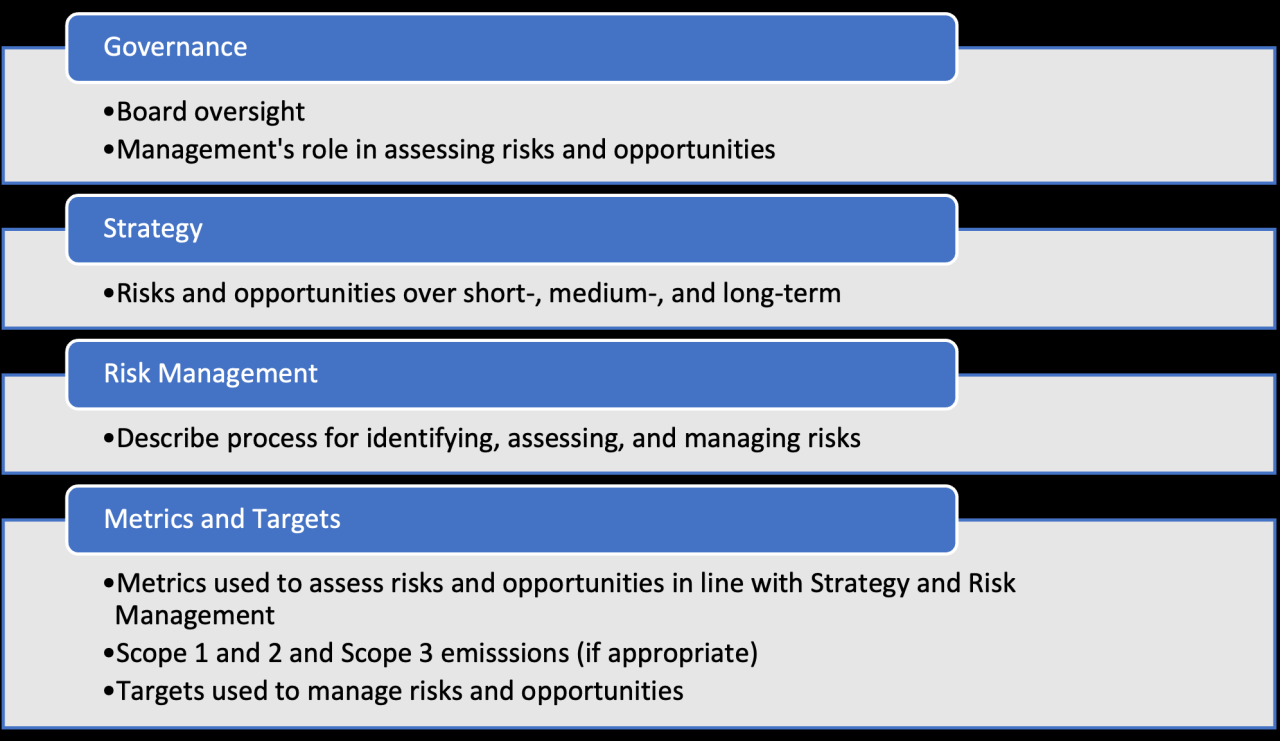
The TCFD framework recommends disclosures in four key areas: Governance, Strategy, Risk Management, and Metrics and Targets. These four areas cover the essential elements for a comprehensive assessment of climate-related financial risks. Companies using the TCFD framework are expected to Artikel their approach to climate-related issues, their strategy for managing those risks, and their progress in implementing those strategies.
This framework provides a structured approach to understanding and disclosing climate risks, allowing investors to make informed decisions.
Process for Reporting Climate-Related Risks
The process for reporting climate-related risks varies based on the organization’s size, industry, and specific circumstances. Generally, it involves identifying potential climate-related risks, assessing their financial impact, developing mitigation strategies, and regularly reporting on progress. Reporting should be consistent, transparent, and readily available to stakeholders. Companies need to clearly Artikel their methodologies for assessing climate-related risks, ensuring transparency and consistency.
Best Practices for Disclosure
Best practices for climate-related disclosure emphasize clarity, completeness, and consistency. Companies should provide specific examples of how climate-related risks are affecting their operations, including detailed quantitative analysis wherever possible. The disclosures should be easily accessible and understandable to stakeholders, presented in a clear and concise manner. Regularly updating disclosures and providing supporting data demonstrate a commitment to ongoing risk management.
Disclosure Requirements and Impact
| Disclosure Requirement | Impact on the Sector |
|---|---|
| TCFD Recommendations | Increased transparency and comparability, leading to better investment decisions and more effective risk management. |
| SASB Standards | Alignment with industry-specific sustainability standards, facilitating better risk assessment and decision-making. |
| GRI Standards | Consistent reporting on environmental and social issues, enabling stakeholders to evaluate an organization’s broader sustainability performance. |
| SEC Regulations | Legal requirements for climate-related disclosures, ensuring compliance and accountability. |
Building Resilience
Navigating the volatile climate landscape requires a proactive and multifaceted approach for financial institutions. Building resilience involves more than just reacting to risks; it necessitates a fundamental shift towards anticipating and mitigating potential impacts. This proactive stance ensures the long-term sustainability and stability of the financial sector.Financial institutions can bolster their resilience against climate-related risks by adopting a range of strategies that prioritize diversification and mitigation.
These strategies aim to reduce vulnerability to shocks, minimize potential losses, and ensure the continued provision of essential financial services.
Diversification Strategies
Diversifying investment portfolios across different asset classes and geographies can significantly reduce exposure to localized climate impacts. For example, a bank heavily invested in coastal real estate might diversify its portfolio by investing in inland properties, or by investing in renewable energy companies. This reduces the concentration of risk and minimizes the potential for catastrophic losses. Diversification strategies not only enhance resilience but also unlock opportunities in emerging green sectors.
Hedging Strategies
Hedging strategies offer a powerful tool to manage and mitigate climate-related risks. These strategies use financial instruments to offset potential losses. For example, financial institutions can use weather derivatives to hedge against extreme weather events like floods or droughts. This involves buying insurance policies or using other financial contracts to offset potential losses associated with such events.
By implementing hedging strategies, financial institutions can transfer risk and limit their exposure to potential damage.
Strengthening Internal Controls
Robust internal controls are crucial for effective risk management. These controls involve establishing clear protocols for identifying, assessing, and monitoring climate-related risks. A key component of this involves developing scenario analysis that evaluates potential climate impacts on various aspects of the institution’s operations, including asset valuations and loan portfolios. This enables institutions to prepare for various scenarios and anticipate potential disruptions.
Regular audits and stress tests help validate the effectiveness of the controls and enhance the overall resilience of the institution.
Example of Diversification and Hedging
Imagine a bank with a significant loan portfolio focused on agriculture in a region vulnerable to droughts. Implementing diversification strategies might involve expanding the loan portfolio to include businesses involved in water conservation technologies, or investing in drought-resistant crops. Hedging against drought risk could involve using weather derivatives to offset potential losses in agricultural yields.
Comparing Resilience-Building Strategies
| Strategy | Description | Advantages | Disadvantages |
|---|---|---|---|
| Diversification | Spreading investments across different asset classes and geographies | Reduces concentration risk, enhances portfolio stability | May require investment in unfamiliar sectors, potential for lower returns in some areas |
| Hedging | Using financial instruments to offset potential losses | Transfers risk to third parties, limits exposure to specific events | Requires expertise in financial instruments, potential for complex transactions |
| Internal Control Strengthening | Developing comprehensive risk management framework and protocols | Provides structured approach to risk assessment, improved operational efficiency | Requires significant investment in resources and training, may be time-consuming |
Case Studies
Navigating the complex landscape of climate-related financial risks requires learning from the experiences of others. Real-world case studies provide valuable insights into how institutions have responded to these challenges, highlighting both successes and failures. Understanding these past events can help inform current and future strategies for mitigating and managing climate-related risks.
Case Study 1: The Impact of Extreme Weather on Insurance Companies
The increasing frequency and intensity of extreme weather events, such as hurricanes and floods, have significantly impacted insurance companies. These events lead to a surge in claims, exceeding the capacity of insurers to handle them financially. A notable example is the impact of Hurricane Harvey on the Texas insurance market in 2017. The sheer volume of claims overwhelmed the capacity of several insurers, causing significant financial strain.
Lessons learned include the need for better risk assessment models that incorporate climate change projections, the importance of diversifying insurance portfolios, and the necessity of having robust contingency plans for extreme events.
Case Study 2: The Fossil Fuel Transition and Investment Portfolios
The shift towards a low-carbon economy presents challenges for financial institutions holding investments in fossil fuel companies. As governments and consumers increasingly move away from fossil fuels, these investments can lose value, and companies can face regulatory hurdles. Consider the case of several large pension funds and investment firms holding substantial positions in coal-related companies. The decreasing demand for coal, combined with the introduction of carbon pricing and stricter environmental regulations, has negatively impacted the value of these investments.
This demonstrates the crucial role of assessing and adapting investment strategies in the face of evolving climate policy. It emphasizes the importance of incorporating environmental, social, and governance (ESG) factors into investment decision-making and proactive engagement with portfolio companies.
Comparing and Contrasting Approaches
The insurance companies, facing immediate and tangible losses from extreme weather events, focused primarily on improving risk assessment models and enhancing their disaster response mechanisms. In contrast, institutions with fossil fuel investments faced a longer-term challenge, necessitating a more strategic shift in investment portfolios. This required not just assessing the risks but also actively engaging with portfolio companies to promote sustainable practices.
The difference highlights the diverse nature of climate-related risks and the need for tailored responses.
Challenges and Lessons Learned
The case studies illustrate several common challenges. One major obstacle is the difficulty of accurately predicting the future impacts of climate change. Another is the challenge of incorporating climate risks into existing financial models. Further, the complexities of the transition to a low-carbon economy demand strategic planning and engagement with diverse stakeholders. Institutions that proactively addressed these challenges and adapted their strategies demonstrated greater resilience and were better positioned to navigate the evolving climate landscape.
A key lesson is the importance of continuous learning and adaptation to the evolving realities of climate change.
Key Factors Contributing to Success or Failure
Several key factors determined the success or failure of the institutions in the case studies. Proactive risk assessment, robust contingency planning, and the ability to adapt to changing circumstances were crucial elements for success. Conversely, institutions that failed to anticipate or adequately address the changing risks often faced significant setbacks. The ability to engage with stakeholders, including regulators and investors, was also crucial in facilitating successful adaptation.
Moreover, early adoption of innovative solutions, such as carbon pricing mechanisms, and proactive investment in renewable energy demonstrated a proactive approach to mitigating risks.
Summary Table of Key Takeaways
| Case Study | Key Challenges | Key Lessons Learned | Key Success Factors |
|---|---|---|---|
| Extreme Weather Impact on Insurance | Surge in claims, exceeding capacity, inadequate risk models | Importance of climate-adjusted risk assessment, diversification, contingency planning | Proactive risk management, robust response mechanisms, adaptation |
| Fossil Fuel Transition & Investment Portfolios | Decreasing demand, regulatory hurdles, portfolio value decline | Importance of ESG factors, strategic portfolio shifts, stakeholder engagement | Proactive engagement, adaptation to low-carbon economy, investment in sustainable solutions |
Future Outlook
The future of climate-related financial risks is undeniably complex and multifaceted. While the current understanding of these risks is substantial, navigating the evolving landscape requires a proactive approach. The increasing frequency and intensity of extreme weather events, coupled with the transition to a low-carbon economy, are poised to reshape the financial sector. This necessitates a forward-thinking perspective, anticipating potential challenges and opportunities.
Forecasting Future Climate-Related Financial Risks
The projected increase in global temperatures and the resulting extreme weather events will directly impact asset values and operational stability for financial institutions. For example, rising sea levels threaten coastal property values and infrastructure, leading to potential losses for insurers and investors. Similarly, more frequent and intense droughts and floods can significantly damage agricultural production, impacting supply chains and investment portfolios.
These risks are not isolated incidents; they are interconnected, creating a cascading effect that requires comprehensive risk management strategies.
Evolution of Regulatory Frameworks
Regulatory frameworks are expected to become more stringent and comprehensive in addressing climate-related financial risks. Governments worldwide are recognizing the urgent need for standardized disclosures and reporting mechanisms for climate-related risks and opportunities. International collaborations will likely intensify, with global standards emerging to ensure consistency and comparability. The introduction of stricter regulations on financial institutions’ environmental, social, and governance (ESG) practices is also anticipated.
Examples of this evolution include the increasing focus on climate-related scenario analysis and the potential for mandatory disclosure requirements for climate-related risks across various financial instruments.
Technological Advancements in Addressing Climate Risks
Technological advancements are crucial for mitigating climate-related financial risks. Improved climate modeling and data analysis can enhance the accuracy of risk assessments. Advanced analytics, machine learning, and artificial intelligence can identify patterns and predict future climate impacts with greater precision. For example, these technologies can aid in the development of climate-resilient infrastructure and the assessment of physical and transition risks for financial portfolios.
Role of Financial Institutions in Climate Action
Financial institutions are not just risk managers; they are increasingly becoming active participants in climate action. A growing number of institutions are integrating climate considerations into their investment strategies, lending practices, and operational activities. This includes supporting sustainable technologies, investing in renewable energy projects, and financing climate-resilient infrastructure. The role of financial institutions is evolving from simply managing risk to actively driving positive change and contributing to a sustainable future.
Potential Future Trends and Implications
| Potential Future Trend | Implications |
|---|---|
| Increased frequency and severity of extreme weather events | Higher asset losses, increased insurance claims, and disruptions to supply chains. |
| Growing regulatory scrutiny and standardization | Increased compliance costs, more transparent risk assessments, and potential for market inefficiencies. |
| Technological advancements in risk assessment | Improved risk modeling, greater accuracy in predicting climate impacts, and opportunities for developing climate-resilient solutions. |
| Active participation of financial institutions in climate action | Shift towards sustainable investments, reduced emissions, and a more sustainable financial system. |
| Emergence of climate-linked financial products | New investment opportunities, but also potential for increased complexity and market volatility. |
Last Word
This finance sector climate related risks guide has explored the intricate relationship between climate change and finance, outlining the critical risks, assessment methodologies, mitigation strategies, and disclosure requirements. The guide’s case studies illustrate the real-world implications of these risks, offering valuable lessons for financial institutions. Moving forward, building resilience and fostering transparency are crucial for navigating the evolving landscape of climate-related financial risks and fostering a sustainable financial system.
The future of finance depends on our collective ability to adapt and mitigate these risks.
