Tech Veteran Jeff Atwood and Collaborators Launch Dream Again USA to Quantify American Wealth Disparity Through Immersive Digital Design

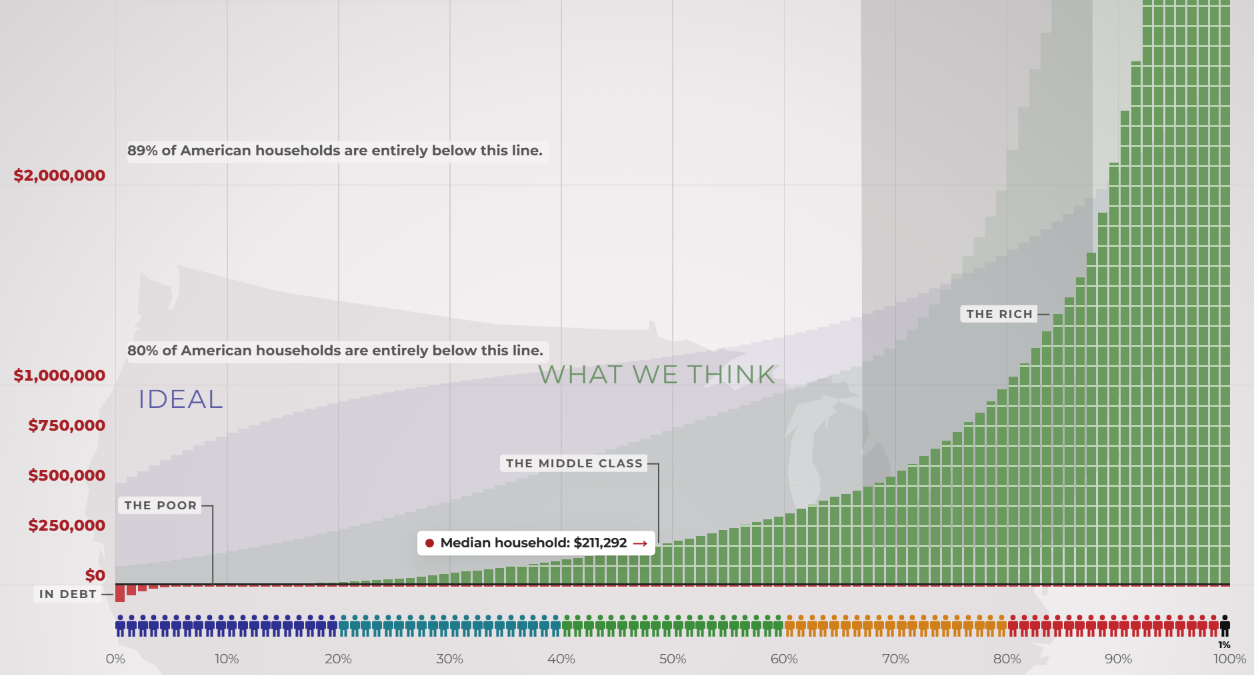
The digital landscape has long prioritized seamless user experiences, frictionless interactions, and immediate gratification. However, a new web-based project titled Dream Again USA intentionally subverts these principles to confront one of the most polarizing economic realities of the modern era: extreme wealth inequality in the United States. Developed by software engineer Geoff Dalgas—noted for his foundational work alongside Jeff Atwood on the developer platform Stack Overflow—the interactive website asks users to physically scroll upward along a linear scale representing the vast chasm between the nation’s poorest citizens and its wealthiest individuals.
The launch of the platform coincides with the release of an updated 2026 video series exploring wealth concentration, building upon viral educational formats that first gained widespread digital prominence over a decade ago. By forcing visitors to manually endure an exhaustive scrolling process, the project attempts to translate abstract economic statistics into a visceral, tangible trial of endurance.
The Architecture of Economic Disparity
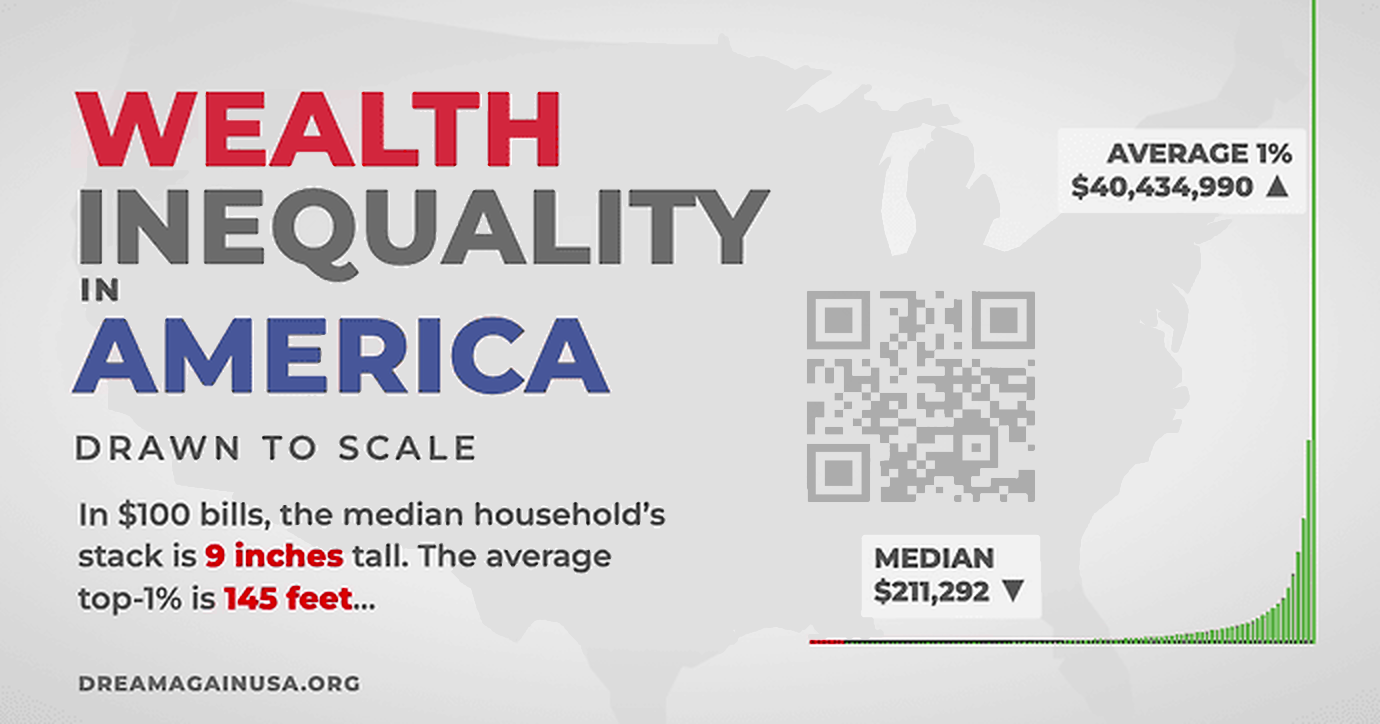
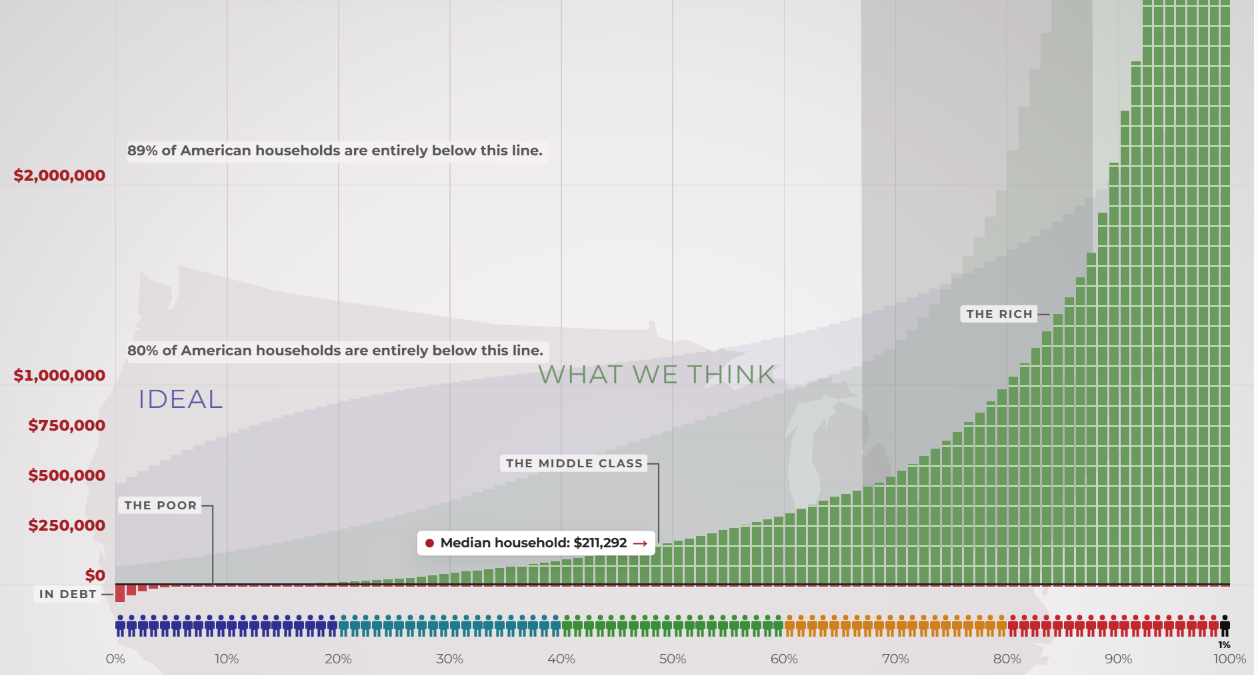
At the core of Dream Again USA is a linear data visualization model that rejects compressed logarithmic scales in favor of true proportional representation. On a standard logarithmic chart, massive gaps in capital and assets can be visually flattened, making extreme disparities appear manageable or abstract. By contrast, a linear scale demonstrates the sheer magnitude of financial divergence in the United States.

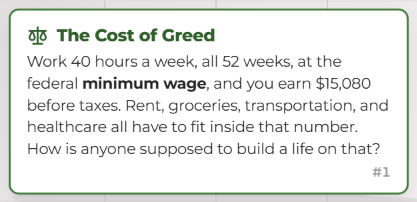
When users open the platform, they begin at the bottom of the graph, representing individuals earning the federal minimum wage or living in deep poverty. A full-time minimum-wage schedule—operating at 40 hours a week across 52 weeks—yields an annual pre-tax income of approximately $15,080. Within this constraint, individuals must account for escalating costs of rent, groceries, transportation, and healthcare.
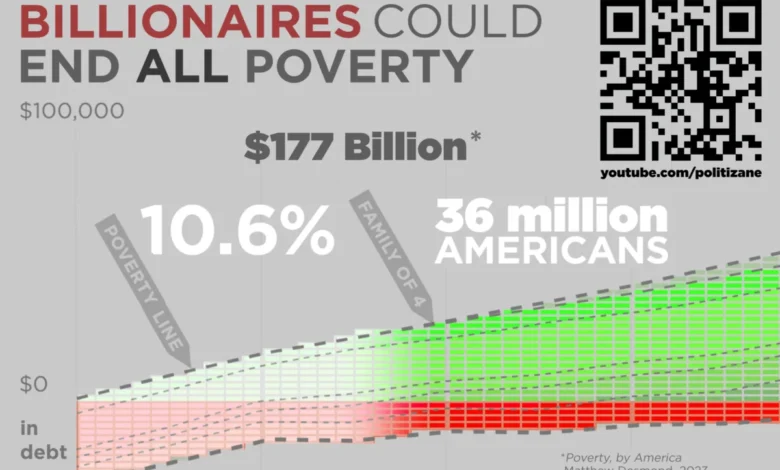
As visitors attempt to scroll upward toward the pinnacle of the nation’s wealth distribution, the physical act becomes arduous. Atwood noted that completing the continuous scroll can take nearly 13 minutes, testing the user’s patience and stamina. Throughout this digital climb, the interface intentionally introduces forced pauses at significant milestones. Notably, the platform halts the user’s progress at the threshold representing the 36 million Americans currently living in poverty. This design choice highlights a stark economic juxtaposition: analysts estimate that total systemic poverty in the United States could be eradicated for an estimated $177 billion—a fraction of the capital accumulated by the country’s wealthiest billionaires.
Historical Context and the Evolution of Wealth Visualization
The conceptual framework behind Dream Again USA traces its lineage to educational media initiatives that originally surfaced in the early 2010s. A seminal video detailing American wealth inequality circulated widely across digital platforms, fundamentally altering public discourse regarding the concentration of corporate and private capital. Over the subsequent decade, income inequality metrics have continued to widen, prompting creators and technologists to revisit these themes with updated methodologies and modern web technologies.
The 2026 iteration of the project was produced in collaboration with independent digital creators and media entities, including Politizane, editorial contributions from The Onion, and insights from Garbage Day. According to the project’s organizers, participating contributors maintained absolute editorial and creative control, ensuring that the presentation remained focused on public awareness rather than corporate messaging or partisan advocacy.
The Philosophy of Inconvenient Design
In traditional software development, friction is considered a defect. User experience designers invest substantial resources into minimizing clicks, reducing load times, and streamlining navigation. Dream Again USA deliberately inverts this paradigm. By treating user exhaustion as a design feature, the platform creates an experiential parallel to systemic economic hardship.
The website does not offer automated scrolling or rapid-jump mechanisms to bypass the distance between economic tiers. Users must physically engage with their input devices, simulating the relentless, day-to-day endurance required of low-income workers navigating financial precarity. Atwood, reflecting on his career in user interface design, observed that while the software actively punishes the user’s patience, the underlying data itself constitutes the true source of friction.

To accommodate audiences seeking offline or analog engagements, the project team also developed an eight-page printable version of the graph. Designed to span six feet and six inches—the average height of a professional basketball player—the physical artifact provides a spatial visualization of the data, allowing educators, students, and researchers to examine the distribution offline.
Broader Implications and Public Response
As economic debates intensify surrounding taxation policies, social safety nets, and corporate governance, visual tools like Dream Again USA play a distinct role in shaping public literacy. Economists and sociologists have long noted that human cognition struggles to accurately perceive exponential numbers or vast numerical differences without effective physical or visual analogies.
By grounding macroeconomic data in a grueling physical interaction, the platform forces an engagement that static charts and bullet points frequently fail to achieve. While critics of provocative digital art installations often debate the efficacy of symbolic activism, proponents argue that making inequality computationally and experientially unavoidable is a vital step toward informed civic discourse.
Ultimately, Dream Again USA offers no policy prescriptions or legislative roadmaps. Instead, it places the burden of observation directly upon the individual user, culminating in a blunt concluding query for those who manage to reach the upper echelons of the digital ascent: Was it worth it?