Inside the 2018 Private SaaS Company Survey: Key Operational, Financial, and Growth Benchmarks Revealed


The release of Part 2 of the comprehensive 2018 private SaaS company survey marks a significant milestone in the ongoing collaboration between industry experts and financial institutions. Produced in partnership with the KBCM Technology Group—formerly recognized as Pacific Crest Securities—this marks the sixth consecutive year that researchers have compiled this extensive data set. Designed to serve as an essential navigational tool for software-as-a-service (SaaS) executives, the annual report offers a rare, data-driven window into the inner workings of privately held cloud companies, allowing leadership teams to accurately benchmark their performance against industry competitors.
While Part 1 of the 2018 findings focused primarily on top-line growth trajectories, go-to-market strategies, customer acquisition cost (CAC) ratios, and payback periods, the newly released Part 2 shifts its analytical lens toward internal operations, cost structures, pricing mechanics, retention dynamics, and capital efficiency. With responses gathered from hundreds of private SaaS entities spanning various scales and verticals, the report highlights emerging operational trends that are reshaping how modern software companies scale, deliver applications, and manage capital.
Cloud Infrastructure Dominance and Delivery Trends
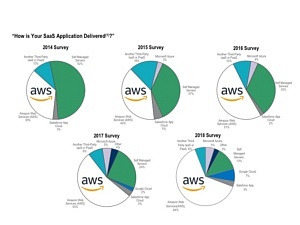
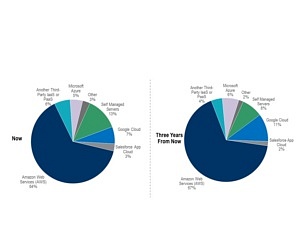
One of the most pronounced operational shifts documented in the 2018 survey centers on how SaaS applications are delivered to end-users. The days of companies relying heavily on self-managed, on-premise hardware infrastructure are rapidly fading into obsolescence. According to the survey data, an overwhelming 87% of participating companies rely primarily on third-party cloud infrastructure providers to host and deliver their applications.

Among those utilizing third-party hosting, Amazon Web Services (AWS) maintains an ironclad grip on the market, capturing nearly three-quarters of the share among respondents. Other cloud providers, including Microsoft Azure and Google Cloud, command smaller slices of the respondent base, though their usage distributions highlight growing, albeit niche, adoption. Historical trend data stretching back to 2014 demonstrates a steady, uninterrupted migration toward third-party cloud ecosystems.

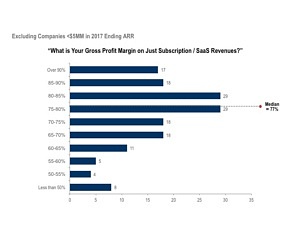
A closer examination of application delivery models relative to company size reveals that self-managed servers are now almost exclusively the domain of the largest and oldest vendors in the cohort. However, even these legacy players have accelerated their migration to AWS and other cloud platforms compared to prior survey cycles. Intriguingly, despite the massive differences in underlying infrastructure management, the report notes that median subscription gross margins do not vary significantly across different delivery methods, suggesting that cloud hosting costs have largely commoditized without severely impacting bottom-line profitability.

Professional Services and Sales Compensation Structures
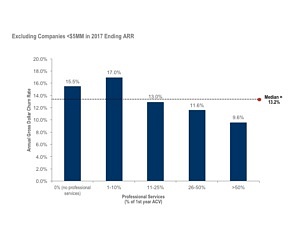
The survey also sheds light on professional services, sales commissions, and go-to-market execution, providing vital clarity for organizations scaling their revenue engines. As expected, the data confirms a direct correlation between a company’s target customer base and the volume of professional services it provides. Organizations heavily focused on selling into large enterprise accounts consistently report higher professional services revenue as a percentage of first-year Annual Recurring Revenue (ARR) compared to those targeting small-to-medium businesses (SMBs) or very small businesses (VSBs). Upfront professional services, while increasing operational complexity, were also shown to correlate with lower customer churn, acting as an effective implementation anchor for enterprise buyers.
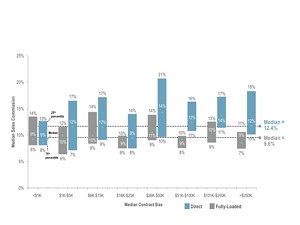
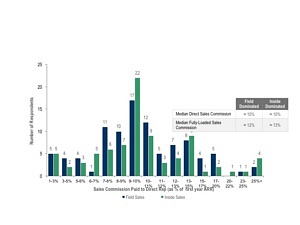
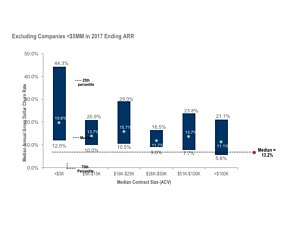
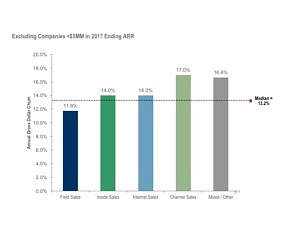
Regarding sales compensation, the 2018 data challenges several conventional assumptions within the tech sector. Analysts found no statistically significant difference in sales commission rates between companies utilizing field-based sales teams versus those relying primarily on inside sales operations. Furthermore, median direct sales and fully loaded commission rates remained remarkably stable across varying median contract sizes, showing little deviation whether a company routinely closed transactions under $5,000 or exceeded $250,000 in Annual Contract Value (ACV).
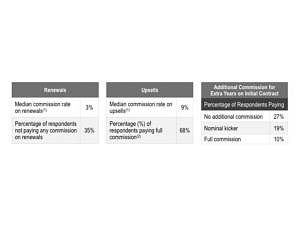
When examining compensation for contract expansions, the survey evaluated direct commissions paid for renewals, upsells, and multi-year commitments. A significant portion of respondents reported paying direct incentives for upsells and additional contract years, aligning sales force incentives with long-term customer lifetime value rather than just initial customer acquisition.
Cost Structures and Financial Performance Benchmarks
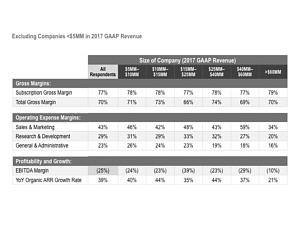
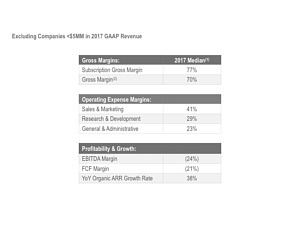
Financial discipline remains a central theme of the 2018 report, particularly as private companies mature and face mounting pressure to balance growth with operational efficiency. The survey evaluated median cost structures across various revenue thresholds, utilizing 2017 GAAP financial data adjusted to account for stock-based compensation and customer support expenses included within Cost of Goods Sold (COGS).
As private SaaS companies scale past the $5 million, $10 million, and $50 million revenue milestones, their operational expenditures evolve predictably. Sales and marketing investments typically command the largest share of operating expenses in the early stages of growth, gradually tapering as recurring revenue compounds and brand equity is established. Research and development (R&D) expenditures remain robust across all tiers, reflecting the continuous need for product innovation in a hyper-competitive software landscape.
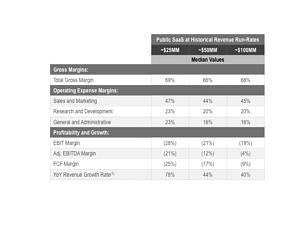
To provide contextual relevance, the survey compared private company metrics against historical financial data from selected public SaaS companies. This comparative analysis illustrates the operational transformation a private company must undergo as it transitions toward a public market listing, particularly regarding gross margins, research intensity, and general and administrative overhead.
Evaluating the Rule of 40%
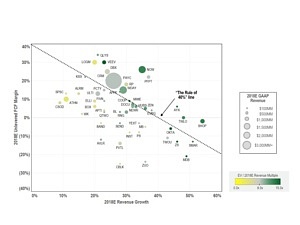
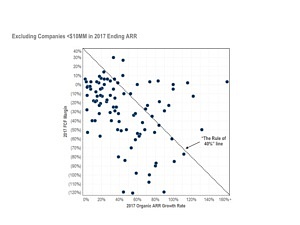
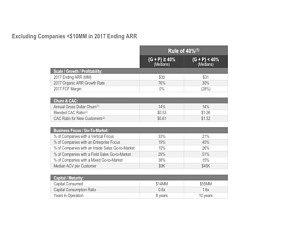
A focal point of the operational analysis is the application of the widely recognized "Rule of 40%," a benchmark stating that a healthy SaaS company’s combined growth rate and free cash flow (FCF) margin should equal or exceed 40%. The survey findings reveal a sobering reality for the private market: only about 20% of respondents with over $10 million in ARR successfully met or exceeded the 40% threshold, with the median company in the cohort registering a combined growth and profitability score of +8%.
A deeper comparative analysis between the elite "Rule of 40%" qualifiers and the broader survey population uncovers distinct strategic differences. While the top-performing companies matched their peers in terms of median size and corporate age, they exhibited significantly lower customer acquisition costs (CAC) and drastically reduced capital consumption ratios. Furthermore, companies achieving the Rule of 40% were markedly more likely to pursue a vertical market focus rather than a broad enterprise-horizontal strategy, underscoring the capital-efficient nature of vertical software models.
For broader market context, the report notes that public SaaS companies boasted a median growth-plus-profitability score of 33% at the time of the study, with approximately 70% of the total public SaaS market capitalization concentrated in companies surpassing the 40% benchmark.
Contracting, Pricing, and Retention Dynamics
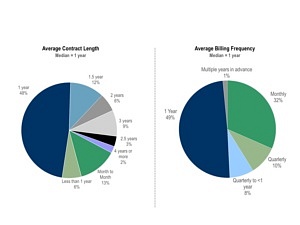
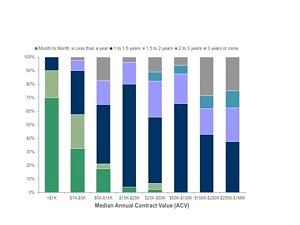
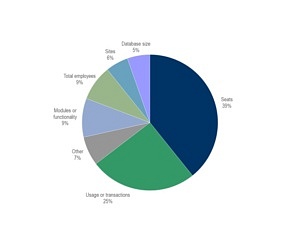
Pricing models, contract terms, and customer retention metrics round out the comprehensive operational dataset. The report indicates that median contract lengths typically hover around one year, though contract duration scales predictably with contract size. Larger enterprise contracts routinely command multi-year commitments and less frequent billing cycles, whereas lower-tier contracts lean toward annual or monthly billing frequencies.
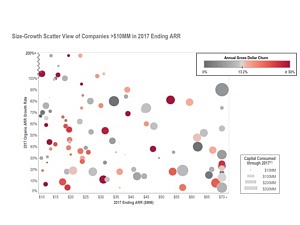
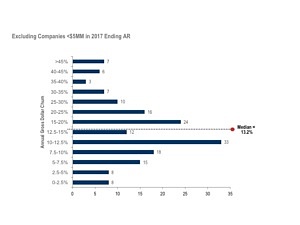
In a methodological update from previous years, the 2018 survey calculated gross dollar churn rates directly from calendar-year data rather than relying solely on self-reported ranges. This adjustment yielded a median annual gross dollar churn rate of 13.2% for 2017. Despite this higher calculated churn figure, net dollar retention remained resilient, holding steady at a median of approximately 102% due to successful upsell and expansion motions within existing accounts.

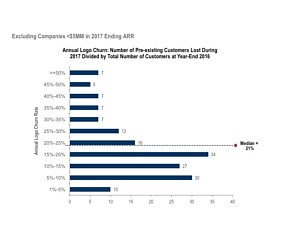
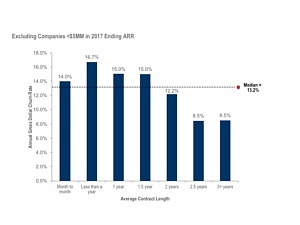
Logo churn was similarly evaluated through direct quantitative responses, providing a clearer picture of customer attrition. Correlative data within the report reaffirmed long-held industry principles: companies featuring longer contract terms, higher upfront professional services engagement, larger median contract sizes, and field-sales distribution models consistently experienced lower annual gross dollar churn rates.
Capital Efficiency and the Role of Debt Financing
Capital allocation and fundraising strategies remain critical considerations for startup founders and executive leadership teams. The survey evaluated capital efficiency by measuring total primary cumulative equity raised, plus debt drawn, against cash reserves on the balance sheet.
Across the respondent base, the median capital consumption ratio stood at 1.5x for companies exceeding $5 million in ARR. Notably, this ratio did not show meaningful downward compression until companies achieved substantial scale surpassing $75 million in ARR, highlighting the intensive capital requirements necessary to fuel continuous hyper-growth in the SaaS sector. Additionally, the report explored the utilization of debt financing, noting that a significant portion of mature private SaaS companies successfully integrate venture debt and credit facilities into their capital stacks to extend runway and optimize their cost of capital without excessive equity dilution.
Implications and Strategic Takeaways
The release of Part 2 of the 2018 private SaaS company survey provides industry stakeholders with an invaluable repository of empirical data. By establishing rigorous benchmarks across application delivery, cost structures, sales compensation, and retention dynamics, the report equips leadership teams with the quantitative insights necessary to navigate complex operational decisions.

As the private cloud market continues to mature against a backdrop of tightening capital efficiency standards and evolving customer expectations, the findings underscore the paramount importance of disciplined execution. Companies that successfully balance robust top-line expansion with disciplined capital management—embodying the principles of the Rule of 40%—are demonstrably better positioned to achieve sustainable, long-term market leadership.
Related posts: