Unveiling the 2018 Private SaaS Company Survey Part 2: Deep Dive into Operations, Churn, and Capital Efficiency


The release of Part 2 of the sixth annual private Software-as-a-Service (SaaS) company survey marks another milestone in the benchmarking of the cloud-computing industry. Conducted in a strategic partnership between leading venture capital entities and the KBCM Technology Group—formerly recognized as Pacific Crest Securities—this comprehensive report offers foundational insights into the operational mechanics, financial structures, and strategic metrics governing private SaaS enterprises. Following the initial rollout of Part 1, which detailed top-line growth trajectories, go-to-market strategies, and Customer Acquisition Cost (CAC) dynamics, this secondary installment shifts its focus inward. It examines vital operational facets including subscription gross margins, application delivery infrastructures, sales commissions, cost structures, retention rates, and capital efficiency.
As the SaaS landscape matures, the necessity for robust, standardized benchmarks becomes increasingly acute for founders, executives, and investors alike. The 2018 report synthesizes data from hundreds of private respondents, providing a granular look at how these companies manage their day-to-day operations while navigating the complexities of scaling. By contrasting these private entities with their public market counterparts, industry stakeholders gain a clearer perspective on the structural adjustments required to transition from early-stage growth to sustainable, enterprise-grade operations.
Operational Infrastructure and Application Delivery Trends
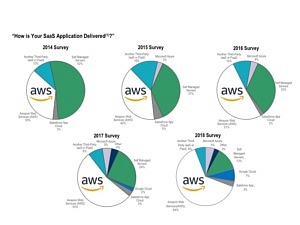
A critical area of focus within Part 2 of the survey is the infrastructure supporting modern SaaS applications. The operational backbone of cloud software has experienced a profound structural evolution over the past decade, moving decisively away from self-managed, on-premise hardware toward scalable, third-party cloud architectures.

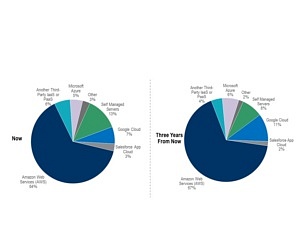
According to the 2018 findings, an overwhelming 87% of survey participants rely predominantly on third-party cloud infrastructure providers to deliver their SaaS applications. Among these providers, Amazon Web Services (AWS) maintains an overwhelmingly dominant market share, powering nearly three-quarters of the third-party deployments reported. Other notable players include Microsoft Azure and Google Cloud, though their adoption rates trail significantly behind AWS within the surveyed cohort. A historical analysis of delivery trends since 2014 demonstrates that this shift is permanent; self-managed servers have become virtually obsolete for emerging and mid-sized vendors, remaining prevalent only among the largest and oldest cohort of software companies. Even within this legacy group, the migration toward cloud providers like AWS accelerated notably in 2018.

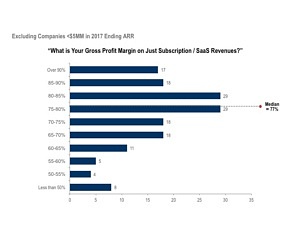
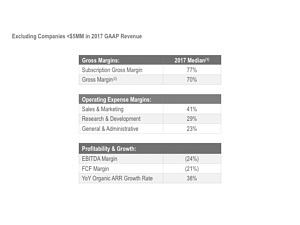
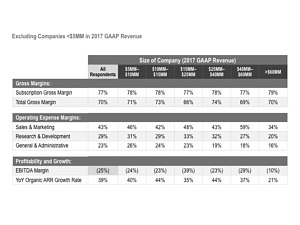
Despite the heavy reliance on external cloud infrastructure, the survey revealed that median subscription gross margins do not vary significantly when filtered by the chosen delivery method. Whether hosted on AWS, Azure, or Google Cloud, companies generally cluster around consistent margin profiles, though platforms with sparser representation, such as Azure and Google Cloud, exhibited broader statistical distributions. Furthermore, the inclusion of customer support expenses within Cost of Goods Sold (COGS)—a standardized adjustment applied across respondents—provides a realistic picture of true subscription profitability.

Sales Compensation, Pricing Models, and Professional Services
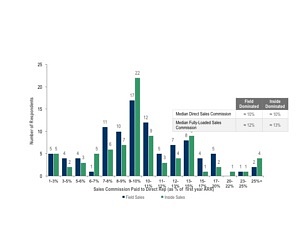
Navigating go-to-market execution requires carefully calibrated compensation frameworks and pricing strategies. The survey explored the nuances of sales commission structures, analyzing whether compensation models differ based on sales methodology, contract size, or deal type.
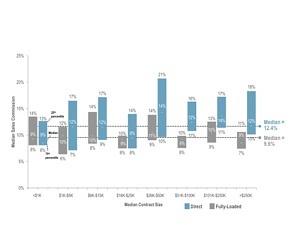
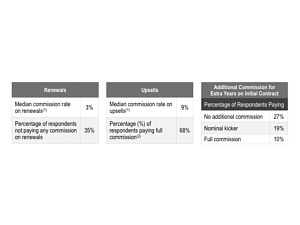
Interestingly, the data indicates that sales commission rates do not exhibit statistically significant variances between companies utilizing field sales teams versus those relying primarily on inside sales operations. Similarly, direct sales and fully loaded commission rates remain remarkably stable across various median contract sizes, ranging from small-dollar transactions under $1,000 to enterprise-level agreements exceeding $250,000. When examining contract modifications—such as renewals, upsells, and the addition of multi-year terms—a majority of companies report paying direct sales commissions for upsells and multi-year extensions at rates comparable to, or higher than, initial new-business acquisitions.
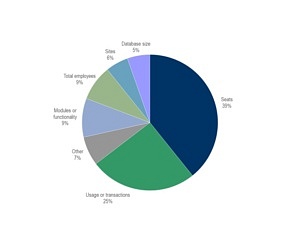
Pricing metrics within the private SaaS sector continue to diversify, though per-user subscription pricing remains the dominant model. Alternative pricing structures, categorized under broad metrics such as host counts, shareholder volumes, brand portfolios, and various financial consumption indicators, occupy a meaningful share of the market, reflecting the unique monetization challenges of specialized B2B software applications.
Professional services also play a variable role depending on the target customer base. As expected, organizations focusing heavily on large enterprise clients report significantly higher levels of professional services as a percentage of first-year Annual Recurring Revenue (ARR). Conversely, companies targeting small-to-medium businesses (SMBs) and very small businesses (VSBs) lean toward low-touch implementation models.
Retention Dynamics: Churn and Net Dollar Retention
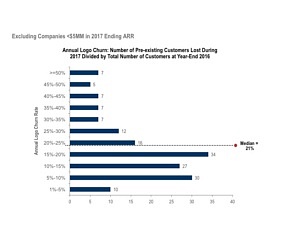
Retention remains the ultimate litmus test for SaaS product-market fit and customer satisfaction. In the 2018 survey, the methodology for collecting gross dollar churn rates was refined from historical self-reported ranges to a precise, calculated median figure for the preceding calendar year.
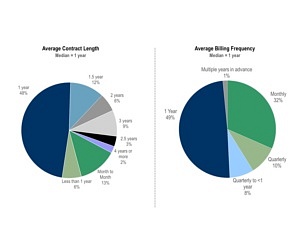
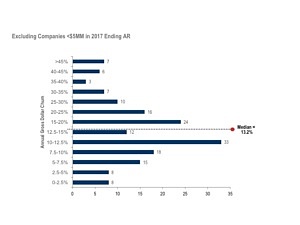
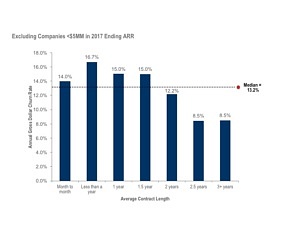
This methodological update yielded a calculated median annual gross dollar churn rate of 13.2% for 2017. While this figure appears higher than self-reported metrics from previous cycles, deeper analysis reveals critical correlations between churn and operational variables. Unsurprisingly, companies securing longer contract terms experience substantially lower annual gross dollar churn. Contract length acts as a stabilizing anchor, reducing customer volatility.
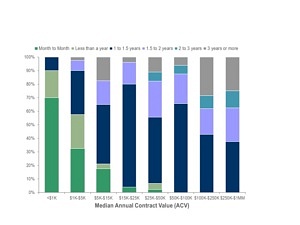
Moreover, the data establishes a compelling link between upfront professional services and reduced churn. Respondents implementing higher tiers of professional services during onboarding reported lower rates of gross dollar attrition, suggesting that comprehensive initial engagement safeguards long-term customer relationships. Similarly, gross dollar churn trends downward as median contract sizes increase, with micro-contracts under $5,000 suffering disproportionately higher attrition rates. Go-to-market strategy also plays a role: enterprises utilizing field sales models reported lower median annual gross dollar churn rates compared to those relying on inside sales, internet sales, or mixed distribution strategies.
Despite the variations observed in gross dollar churn, annual net dollar retention from existing customers remained remarkably resilient, holding steady at a median of approximately 102%. This indicates that successful upsell and expansion motions effectively offset baseline customer attrition for the typical SaaS company.
Capital Efficiency and the Rule of 40%
Capital management is a defining characteristic of corporate maturity in the software sector. The survey introduced refined metrics for evaluating capital efficiency, defining capital consumed as cumulative primary equity raised plus debt drawn, minus cash balances on hand.
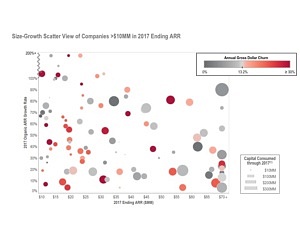
The findings indicate that the median capital consumption ratio sits at approximately 1.5x for companies exceeding $5 million in ARR. This metric remains remarkably sticky, showing no significant capital efficiency gains until companies scale past the $75 million ARR threshold. Debt financing plays a complementary role for many firms, with a significant portion of respondents utilizing debt facilities to extend runway and optimize their capital structures without unnecessary equity dilution.
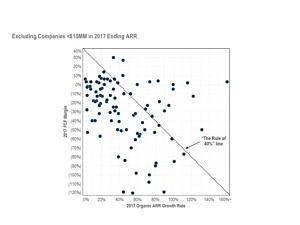
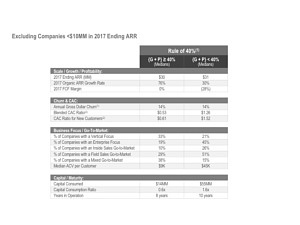
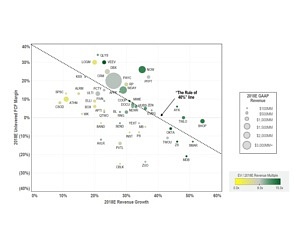
Evaluating performance through the lens of the "Rule of 40%"—which dictates that a software company’s growth rate and profitability (typically measured by Free Cash Flow margin) should sum to at least 40%—yielded sobering insights for private firms. Among survey participants with over $10 million in ARR, only about 20% (21 out of 106 respondents) met or exceeded the 40% threshold, with the median group posting a combined growth and profitability score of +8%.
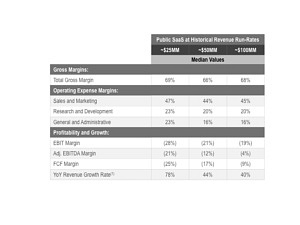
A comparative analysis between these elite performers and the broader survey cohort reveals distinct operational divergences. While top-tier Rule of 40% qualifiers share comparable age and scale profiles with their peers, they achieve their status through significantly lower customer acquisition costs and reduced capital consumption. Furthermore, these high-performing entities are markedly more likely to pursue vertical market strategies rather than broad enterprise plays. For context, public SaaS companies surveyed during the same period boasted a median growth-plus-profitability score of 33%, with approximately 70% of public SaaS market capitalization concentrated above the 40% threshold.

Implications for Industry Executives and Investors
The release of Part 2 of the 2018 SaaS survey provides a vital mirror for private software executives navigating a competitive global market. The data underscores that achieving long-term sustainability requires a delicate balance between aggressive top-line growth, disciplined capital allocation, and rigorous management of operational retention drivers.
As third-party cloud infrastructure solidifies as the universal standard and capital efficiency benchmarks remain demanding, early-stage and growth-stage executives must look closely at their internal metrics. Companies aiming for public market readiness or high-valuation liquidity events can utilize these findings to identify operational bottlenecks—whether in customer success, pricing architecture, or sales compensation—ensuring their growth trajectories align with the rigorous standards set by industry leaders.