Unveiling the 2018 Private SaaS Company Survey: A Comprehensive Analysis of Growth, Go-to-Market Strategies, and Capital Efficiency


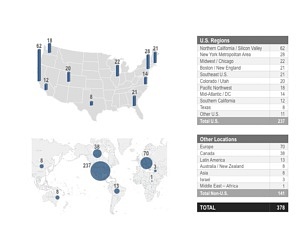
The private Software-as-a-Service (SaaS) industry has long required robust, empirical benchmarking to help founders, executives, and investors navigate the complexities of scaling modern tech enterprises. For the seventh consecutive year, industry publication forEntrepreneurs collaborated with the KBCM Technology Group—formerly recognized as Pacific Crest Securities—to publish the definitive annual SaaS survey. Drawing insights from approximately 385 private SaaS companies globally, this comprehensive report provides an unprecedented look into the operational mechanics, financial metrics, and strategic decisions that define the modern cloud software landscape.
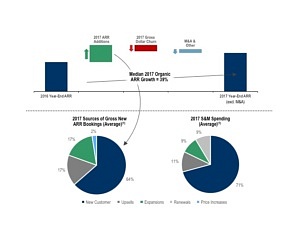
By refining its methodology for this edition, the survey asked respondents to provide precise numerical data rather than broad ranges for key financial indicators such as Annual Recurring Rate (ARR), customer churn, and the attribution of sales and marketing expenditures. These exact figures empowered analysts to compute direct metrics for the 2017 fiscal year, offering a granular view of human capital efficiency, organic growth trajectories, distribution models, and Customer Acquisition Cost (CAC) dynamics.
Evolution and Scope of the 2017 SaaS Survey
The collaboration between forEntrepreneurs and KBCM Technology Group—spearheaded by key industry figures including David Spitz—has evolved into an indispensable resource for the venture capital and tech startup ecosystems. Over seven years, the initiative has systematically mapped the maturation of the SaaS business model, tracking how companies transition from early-stage ventures into mature enterprise software providers.
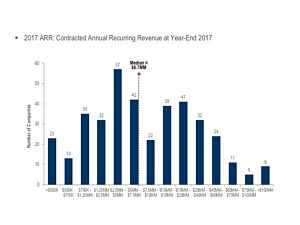
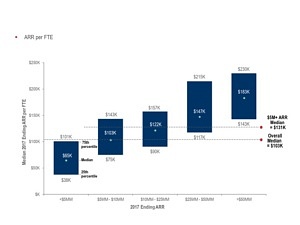
The 2017 dataset reflects a diverse cross-section of the global private technology sector. Survey participant composition spanned a wide spectrum of corporate scales, categorized by their ARR tiers. Out of 384 respondents reporting on human capital efficiency (measured by ARR per Full-Time Equivalent, or FTE), 160 companies generated under $5 million in ARR, 65 reported between $5 million and $10 million, 80 fell into the $10 million to $25 million bracket, 47 ranged from $25 million to $50 million, and 33 enterprises operated at a scale exceeding $50 million in ARR. Geographically and demographically, the participating cohort represented the primary hubs of global innovation, capturing operational realities from emerging startups to established mid-market leaders.
Organic Growth Rates and Scaling Realities
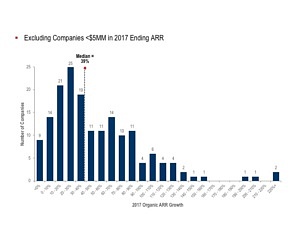
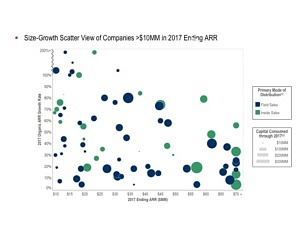
One of the most critical revelations of the 2017 survey centers on the velocity and behavior of organic ARR growth—defined explicitly as growth excluding mergers and acquisitions (M&A). Across a total of 261 respondents providing detailed organic growth data, the report illustrates a fundamental truth of the software industry: hyper-growth becomes increasingly rare as a company scales.
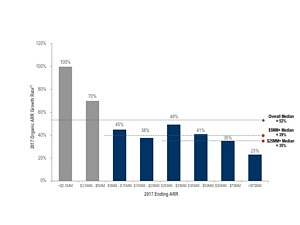
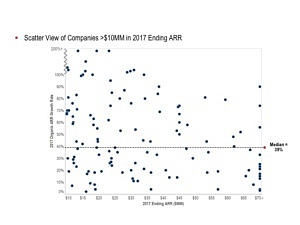
The data reveals a long, sparse "tail" for growth rates residing well above the median. For early-stage companies operating under $2.5 million in ARR (comprising 53 respondents), median growth rates routinely soared past 80 to 100 percent. However, as organizations crossed the $50 million to $75 million threshold (17 respondents) and surpassed $75 million (12 respondents), the median organic growth rate compressed significantly, settling into the sustainable 20 to 30 percent range.
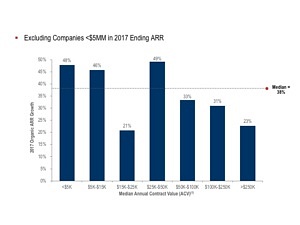
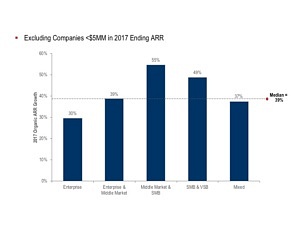
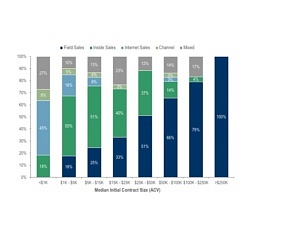
Furthermore, the survey examined median growth rates through the lens of Annual Contract Value (ACV) and target customer profiles. Analyzing 144 respondents, the report categorized companies by their median customer contract sizes. Interestingly, firms commanding low ACVs under $5,000 frequently operated within massive aggregate ARR frameworks (averaging a median ARR of $19 million across 21 respondents), whereas those securing enterprise-level contracts exceeding $250,000 demonstrated diverse scaling patterns. When evaluating target customer segments—segmented into Enterprise (greater than 1,000 employees), Middle Market (100–999 employees), Small and Medium-Sized Businesses (SMBs, 20–100 employees), and Very Small Businesses (VSBs, under 20 employees)—enterprises targeting larger organizational structures maintained distinct operational cost frameworks, heavily relying on multi-tier distribution channels.
Go-To-Market Strategies and Distribution Dynamics
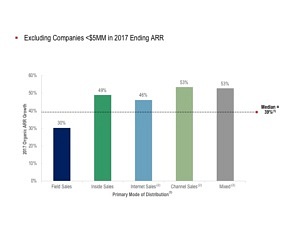
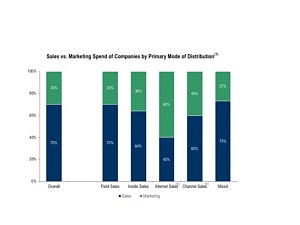
The 2018 report offered a deep dive into go-to-market (GTM) strategies, analyzing the primary modes of distribution utilized by private SaaS firms. A distribution mode was defined as the primary driver of new sales if it contributed at least 30 percentage points more than any alternative channel; otherwise, the strategy was classified as "mixed."
Field sales, inside sales, internet-driven sales, and channel partnerships each demonstrated distinct implications for capital efficiency and growth. Among 163 respondents evaluated for sales strategy impacts, field sales dominated as the primary mode for 78 companies (with a median ARR of $18 million), while inside sales served as the primary engine for 44 companies (median ARR of $19 million). Internet sales and channel sales represented smaller cohorts of 7 and 6 respondents, respectively, though internet-focused models exhibited high initial capital efficiency and rapid scalability at lower contract tiers.
The report also scrutinized the crossover points between field and inside sales. Analyzing 63 respondents in key deal-size tiers where both sales motions overlap, the survey compared customer churn rates, net expansion percentages, and fully-loaded sales efficiency. Field-dominated sales motions typically required larger initial contract sizes to justify the higher fully-loaded compensation and travel expenses associated with enterprise field reps, whereas inside sales teams achieved remarkable capital efficiency in the mid-market tier by leveraging remote demos, digital marketing funnels, and streamlined sales cycles.
Sales and Marketing Composition and Spending vs. Growth
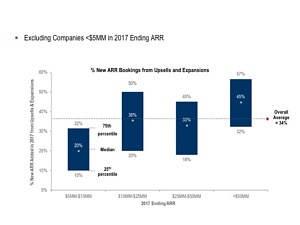
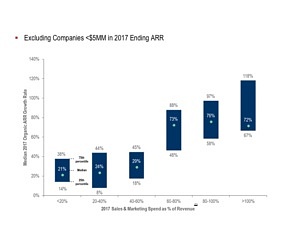
A cornerstone of SaaS financial health is the balance between sales and marketing (S&M) expenditures and the resulting top-line growth. The 2017 survey captured detailed breakdowns of S&M spend relative to new ARR generation, surveying 159 companies across various spending intensity bands.

The findings illustrate that scaling a SaaS business demands aggressive capital allocation toward customer acquisition. Companies were distributed across spending tiers ranging from under 20 percent of revenue to over 100 percent of revenue dedicated to S&M. Predictably, early-stage firms prioritizing aggressive market capture routinely outspent their current revenue streams, investing upwards of 100 percent of their top-line figures into S&M to establish market dominance.
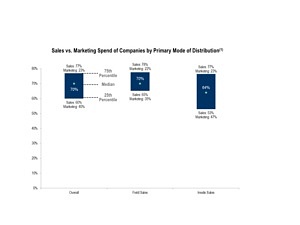
A granular look at S&M composition—specifically the ratio of direct sales compensation versus marketing overhead—revealed that field sales models allocate a substantially higher proportion of their budgets to direct field sales headcount and travel expenses. Conversely, inside and internet sales models skew heavier toward digital marketing acquisition costs, content generation, and lead-generation technology stacks.
Customer Acquisition Cost (CAC) Ratios and Payback Periods
Understanding the true cost of acquiring a customer remains paramount for SaaS executives and institutional investors alike. The survey provided a rigorous comparative analysis between self-reported CAC ratios and mathematically calculated CAC ratios derived from precise 2017 financial figures.
By evaluating calculated CAC ratios across new customer acquisition, upsells, and cross-expansion into existing accounts, the report mapped out the distribution of acquisition efficiency across the industry. The data emphasized that while acquiring a new customer involves high upfront S&M friction, driving expansion and upsell revenue within an established customer base operates at a fraction of the cost. This dynamic underscores why net retention rate (NRR) and gross retention rate have become the ultimate litmus tests for SaaS valuation.

Furthermore, the study calculated the implied CAC Payback Period—defined as the number of months of subscription gross profit required to recover the fully-loaded cost of acquiring a customer. Calculated by dividing the CAC ratio by the subscription gross margin, the median payback periods revealed critical operational benchmarks. While top-tier performers achieved payback periods of under 12 months, many high-growth enterprise SaaS firms accepted payback windows stretching between 18 and 24 months, justified by high customer lifetime values (LTV) and remarkably low net churn rates.
Industry Implications and Strategic Takeaways
The publication of the 2018 survey results arrived at a pivotal juncture for the private technology markets. As venture capital and private equity deployment accelerated throughout the late 2010s, data-driven operational discipline became a mandatory survival skill for executive teams.
The empirical insights provided by forEntrepreneurs and KBCM Technology Group highlighted several vital imperatives for SaaS leadership:
- Capital Efficiency is Non-Negotiable: As companies scale past the $25 million ARR mark, the era of unmitigated cash burn gives way to demands for sustainable operating leverage. Founders must balance growth velocity with disciplined CAC payback periods.
- Channel Alignment Matters: Selecting the appropriate distribution model—whether field, inside, or internet sales—must align strictly with the Average Contract Value (ACV) and the complexity of the target customer’s procurement process. Misalignment between sales motion and contract size is a primary driver of capital inefficiency.
- Expansion Drives Long-Term Value: Relying solely on new customer acquisition is a capital-intensive trap. The survey data emphatically proves that unlocking organic growth through upsells, cross-sells, and account expansions provides a superior, high-margin pathway to enduring enterprise value.
Ultimately, the seventh annual SaaS survey cemented its status as an indispensable baseline for the industry. By replacing industry folklore with hard, audited data, forEntrepreneurs and KBCM Technology Group empowered a new generation of software leaders to build resilient, highly efficient, and enduring cloud enterprises.