The New Frontier of Artificial Intelligence: Agentic Models and the Continuous Evolution of Intelligence

The landscape of artificial intelligence is undergoing a profound transformation, shifting from static, prompt-response systems to dynamic, goal-oriented agents. This evolution is driven by the burgeoning field of agentic AI, which mirrors the relentless refinement seen in elite professional athletes. Just as an athlete constantly adapts and improves between games, agentic AI models are designed for continuous learning and adaptation in response to shifting environments, novel challenges, and evolving toolsets. This paradigm shift necessitates a re-evaluation of how AI models are developed and maintained, placing a new emphasis on "post-training" as a central, ongoing workload.
At its core, agentic AI moves beyond simply generating answers. Instead, these models are tasked with achieving specific goals, requiring them to proactively plan, utilize diverse tools, and demonstrate resilience by recovering from errors encountered during their operation. Unlike generative models that respond to a singular prompt, agentic models are designed to be persistent and adaptive. This inherent need for continuous adaptation stems from the volatile nature of the real-world environments in which these agents operate. The tools an agent might employ can change from week to week, unforeseen edge cases frequently surface in production that were absent from any initial training data, and each deployment introduces a unique ecosystem of codebases, policies, and operational parameters.
Consequently, post-training, the phase traditionally viewed as a final refinement step after initial data training, is no longer a one-time endeavor. It has become a continuous process, indispensable for maintaining the efficacy and intelligence of agentic AI. This ongoing refinement loop is critical because production environments are dynamic. New problems and opportunities for improvement are constantly identified, feeding back into the training cycle. The computational footprint associated with this continuous post-training is substantial, not due to any single run being exceptionally large, but because these refinement cycles are perpetual. This marks a significant departure in AI compute patterns, establishing continuous post-training as the linchpin of the agentic era and the primary determinant of intelligence achievable per dollar invested.
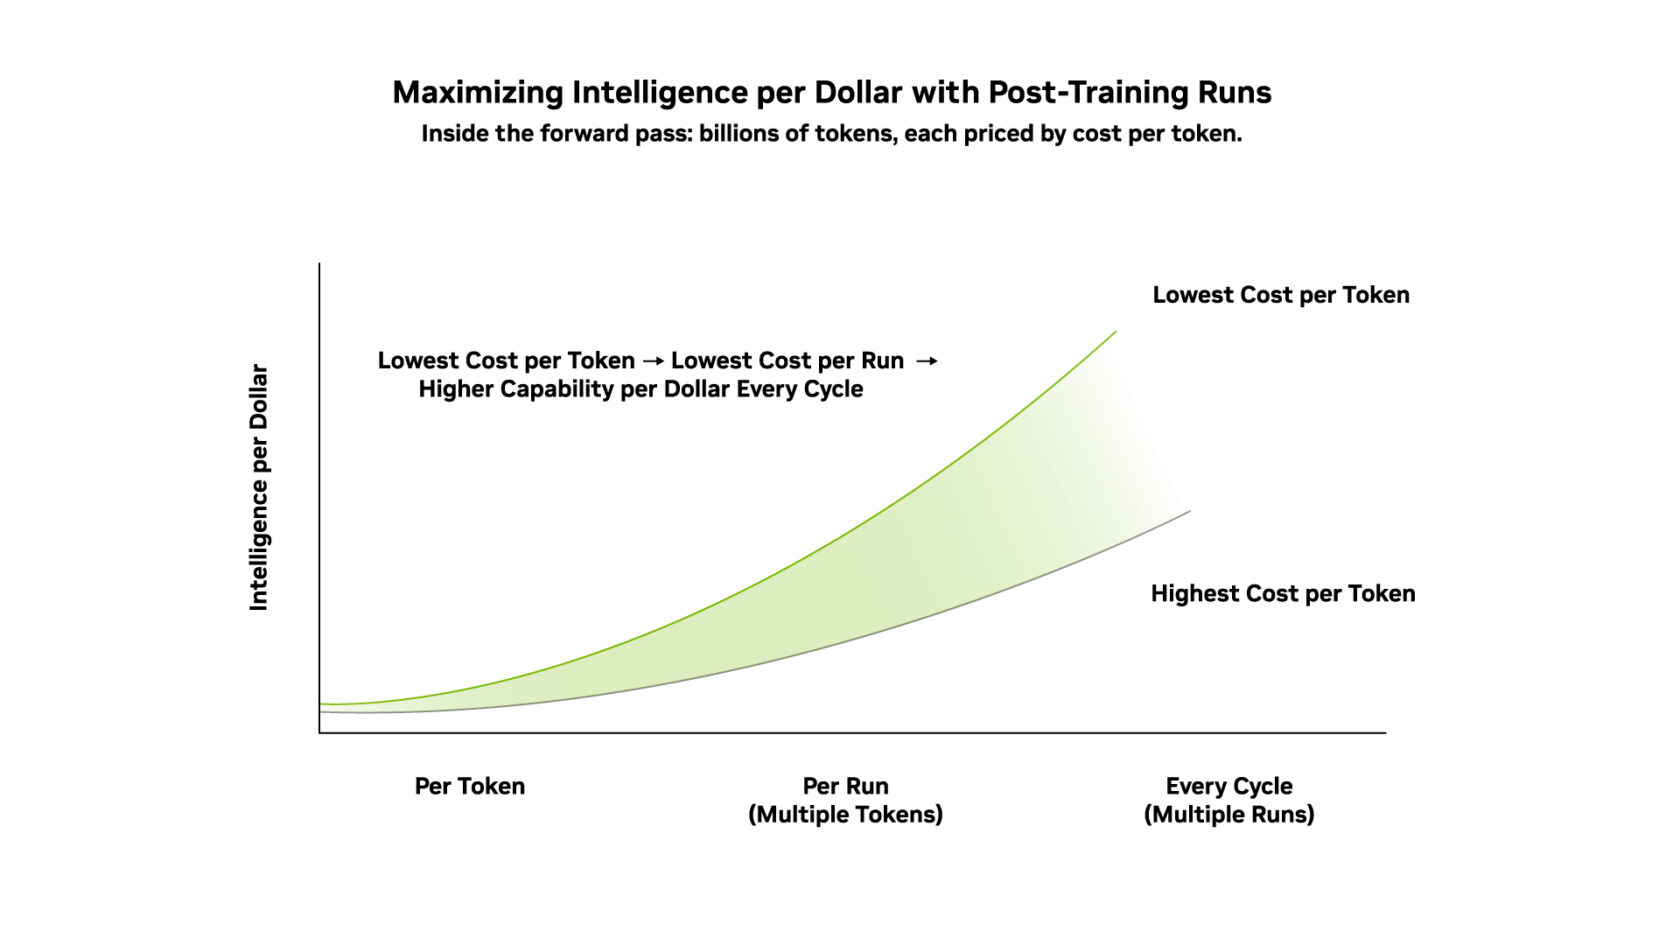
The overarching objective of this continuous post-training is to maximize "intelligence per dollar." This is achieved by optimizing the yield of every computational pass within the learning cycle. The forward pass, which is essentially the inference stage where the model performs its tasks, is measured by its cost per token. Any improvement in reducing this cost per token directly translates into enhanced intelligence per dollar.
Demystifying Agentic Post-Training: Building True Intelligence
The distinction between pre-training and post-training is crucial for understanding the development of true AI intelligence. During pre-training, a model learns to predict the next token in a sequence. While this process imbues the model with fluency and language comprehension, it does not inherently confer intelligence in the form of complex reasoning or problem-solving capabilities. It is in the post-training phase that models acquire the skills necessary for tasks such as writing code, formulating multi-step plans, effectively using external tools like search engines, and crucially, recovering from unexpected failures. Inference, the operational phase, follows this development, where the model’s performance is evaluated and priced based on the cost per token.
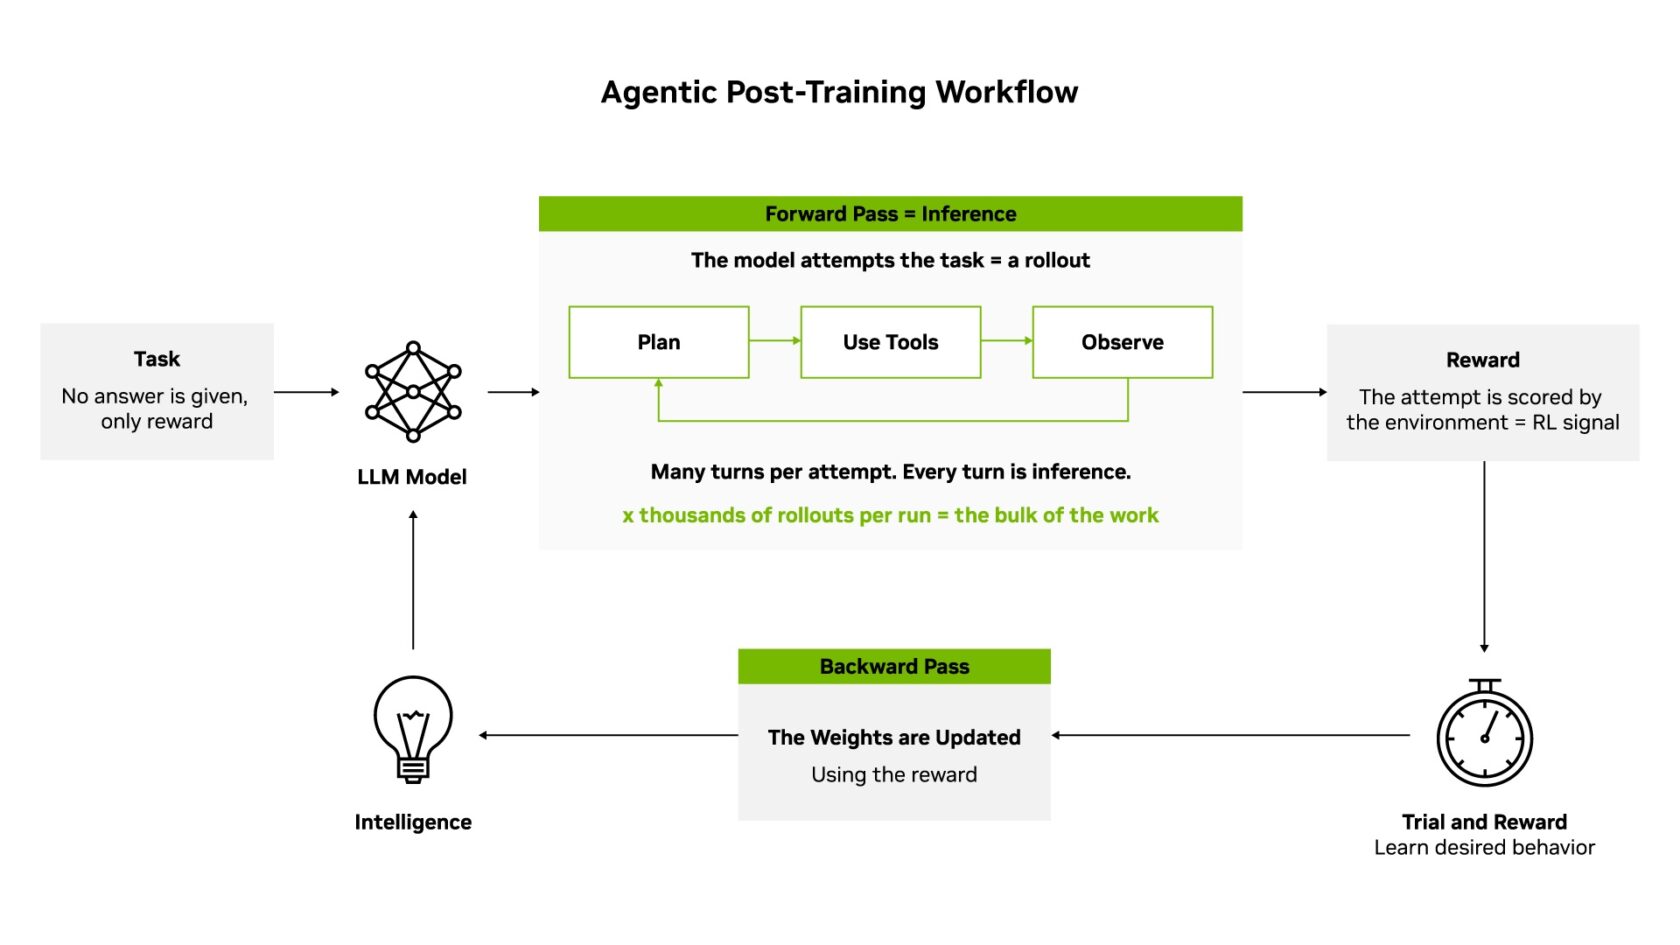
Since there is no fixed set of correct answers to memorize, agentic models learn through a process akin to trial and error, guided by reinforcement learning (RL) techniques. When presented with a task, the model generates an attempt – the forward pass – which is analogous to the work it would perform in a live operational setting. This attempt is then scored, and the feedback is used to update the model’s internal weights through a backward pass. Over millions of such attempts and subsequent updates, the model’s intelligence steadily grows.
Each of these iterative steps is computationally intensive. Orchestrating this process at scale presents a significant challenge, requiring the management of thousands of parallel environments generating "rollouts" (attempts), rigorous verification of rewards, and efficient integration of updated weights back into the training pipeline, all while ensuring optimal utilization of computational accelerators. NVIDIA’s NeMo open libraries, including NeMo Gym for creating training environments and NeMo RL for distributed post-training, are instrumental in transforming this complex process from bespoke research code into a robust, repeatable infrastructure.
The Symbiotic Relationship: Intelligence per Dollar and Cost per Token
The concept of "intelligence per dollar" is inextricably linked to, and amplified by, the optimization of "cost per token." If inference can be considered the revenue-generating engine of an AI system, then post-training acts as a powerful multiplier. The more capable and intelligent a model becomes through effective post-training, the higher the value derived from every token it serves during inference.
Cost per token is a critical metric for the operational efficiency of an AI inference factory, representing the all-in cost to deliver a specific quantity of output, such as one million tokens. Intelligence per dollar, conversely, operates at a higher strategic level, addressing a different, yet interconnected, question: what is the cost to develop a model that is not only capable but also remains valuable and effective as its operational environment evolves?
These two metrics are not mutually exclusive but rather complementary. AI infrastructure that successfully reduces the cost per token also indirectly lowers the cost associated with building each incremental unit of intelligence into the model during post-training. Conversely, every enhancement in model intelligence directly increases the value proposition of the tokens processed by the inference factory. In essence, cost per token quantifies the operational yield, while intelligence per dollar assesses the return on investment in developing and maintaining model intelligence.
Maximizing Intelligence per Dollar: The Case of Nemotron 3 Ultra
NVIDIA’s Nemotron 3 Ultra, an open-weight, 550-billion-parameter Mixture-of-Experts (MoE) model, exemplifies the advancements in agentic AI and its post-training methodologies. Featuring verifiable benchmarks and a transparent post-training recipe executed on the NeMo RL framework, Nemotron 3 Ultra has demonstrated significant capabilities. Notably, it achieved a 71.7% score on SWE-bench, a standard real-world coding benchmark. This impressive result indicates that the model can produce functional fixes for approximately seven out of every ten real software bugs identified in open-source projects, with each fix rigorously validated against the project’s own test suites.

The NVIDIA Blackwell platform plays a pivotal role in making the intensive post-training required for agentic AI economically feasible. By reducing the cost per run, it enables the continuous refinement cycles that are essential for these dynamic models. The intelligence honed through this process is then realized across every token served during inference. Looking ahead, the NVIDIA Vera Rubin platform promises to further accelerate this trajectory. Designed from the ground up to maximize intelligence per dollar for agentic post-training workloads, it enables the training of even larger models with a reduced GPU footprint compared to previous generations, facilitating more extensive rollouts per run, a greater number of concurrent environments, and uninterrupted post-training cycles.
Post-Training Workflows in Practice: Industry Adoption and Innovation
Leading organizations are already leveraging these advanced post-training capabilities. Prime Intellect’s Lab, for instance, continuously refines frontier open models using NVIDIA Blackwell infrastructure and employs NVIDIA Dynamo for inference orchestration. With the advent of the Vera Rubin platform, Prime Intellect plans to significantly expand its reinforcement learning environments, increase the volume of rollouts generated per run, and shorten the iteration loops between training and inference, ultimately aiming to maximize intelligence per dollar for its business clients.
Prime Intellect has also optimized its sandbox infrastructure to integrate seamlessly with NVIDIA Vera CPUs. This integration facilitates low-latency, energy-efficient reinforcement learning, a critical component for agentic model development. By incorporating open-source tools and models like NVIDIA Nemotron and NVIDIA NeMo Gym into its software stack, Prime Intellect has observed substantial performance gains. Comparative analyses of realistic RL sandbox workloads against alternative x86 architectures reveal that Vera CPUs deliver an average throughput improvement of 30% per CPU.
Perplexity, another prominent player in the AI space, runs its RL post-training stack asynchronously across hundreds of NVIDIA GPUs. Its system incorporates an RDMA-based weight transfer engine that synchronizes trillion-parameter models between training and inference compute nodes in under two seconds. The resulting post-trained Qwen3 235B models are then efficiently served on NVIDIA GB200 NVL72 systems.
Furthermore, Together AI offers post-training as a comprehensive service, encompassing supervised fine-tuning, RL, and direct preference optimization. This service is accessible via a feature-rich API and SDK, supporting the full spectrum of post-training operations on their AI Native Cloud platform. Having already optimized its operations on NVIDIA’s existing platform and kernel libraries, Together AI is poised to leverage the capabilities of the Vera Rubin platform to further enhance its offerings.
These industry examples underscore a collective commitment to pushing the boundaries of AI intelligence. The ongoing development and deployment of agentic models, powered by continuous post-training and supported by advanced AI infrastructure like NVIDIA’s Blackwell and Vera Rubin platforms, represent a significant leap forward. The ability to create more adaptive, resilient, and intelligent AI systems at a more cost-effective rate promises to unlock new applications and drive innovation across a multitude of sectors. The focus on maximizing intelligence per dollar is not merely a technical optimization; it is a strategic imperative that will shape the future of artificial intelligence and its impact on society.
Related posts: