5 Free Excel Dashboard Templates for Efficient Project Management and Performance Tracking

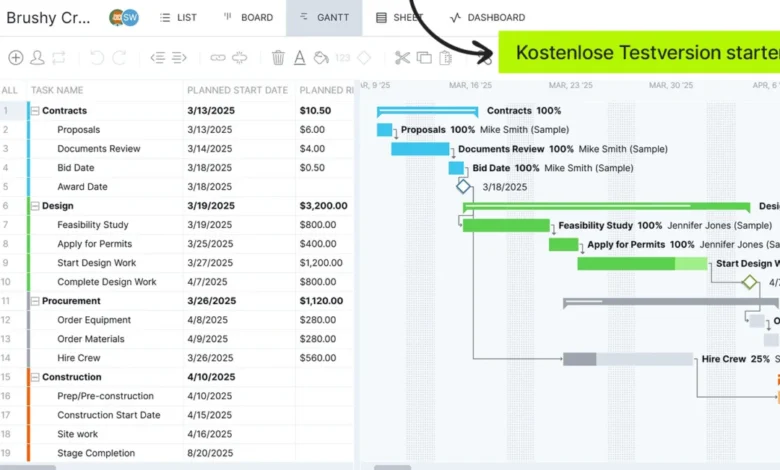
Effective project management relies heavily on the ability to monitor key performance indicators (KPIs) in real-time, anticipate bottlenecks, and ensure that deliverables align with established budgetary and timeline constraints. While modern enterprises increasingly lean toward automated software solutions to orchestrate complex portfolios, spreadsheet applications remain a staple in the administrative toolkit of organizations worldwide. To bridge the gap between traditional manual tracking and comprehensive enterprise systems, industry analysts and project administration platforms frequently release standardized assets designed to simplify data visualization. A prime example is a recently published suite of five complimentary dashboard configurations tailored for Microsoft Excel, aimed at helping teams track everything from general project health and monetary expenditures to specific task progression and physical asset inventories.
The utility of these spreadsheet-based instruments lies in their accessibility and familiarity. For project managers operating within strict budgetary limits or those managing smaller teams that have not yet transitioned to cloud-based software, structured templates offer an immediate mechanism to organize disparate data points. By utilizing visual components such as pie charts, bar graphs, and itemized tables, professionals can evaluate performance metrics without requiring specialized technical training.

Overview of the Five Excel Dashboard Templates
The newly highlighted collection comprises five distinct templates, each engineered to address a specific vertical of operational oversight.
-
Comprehensive Project Dashboard
The primary template serves as a high-level command center for overarching project lifecycles. It consolidates multiple reporting modules into a unified view, employing bar and circle charts to illustrate progress against the baseline project plan. Key visual blocks typically highlight completed versus pending tasks, workload distribution among team members, task durations, and financial comparisons tracking actual expenditures against projected costs.
-
KPI-Focused Performance Dashboard
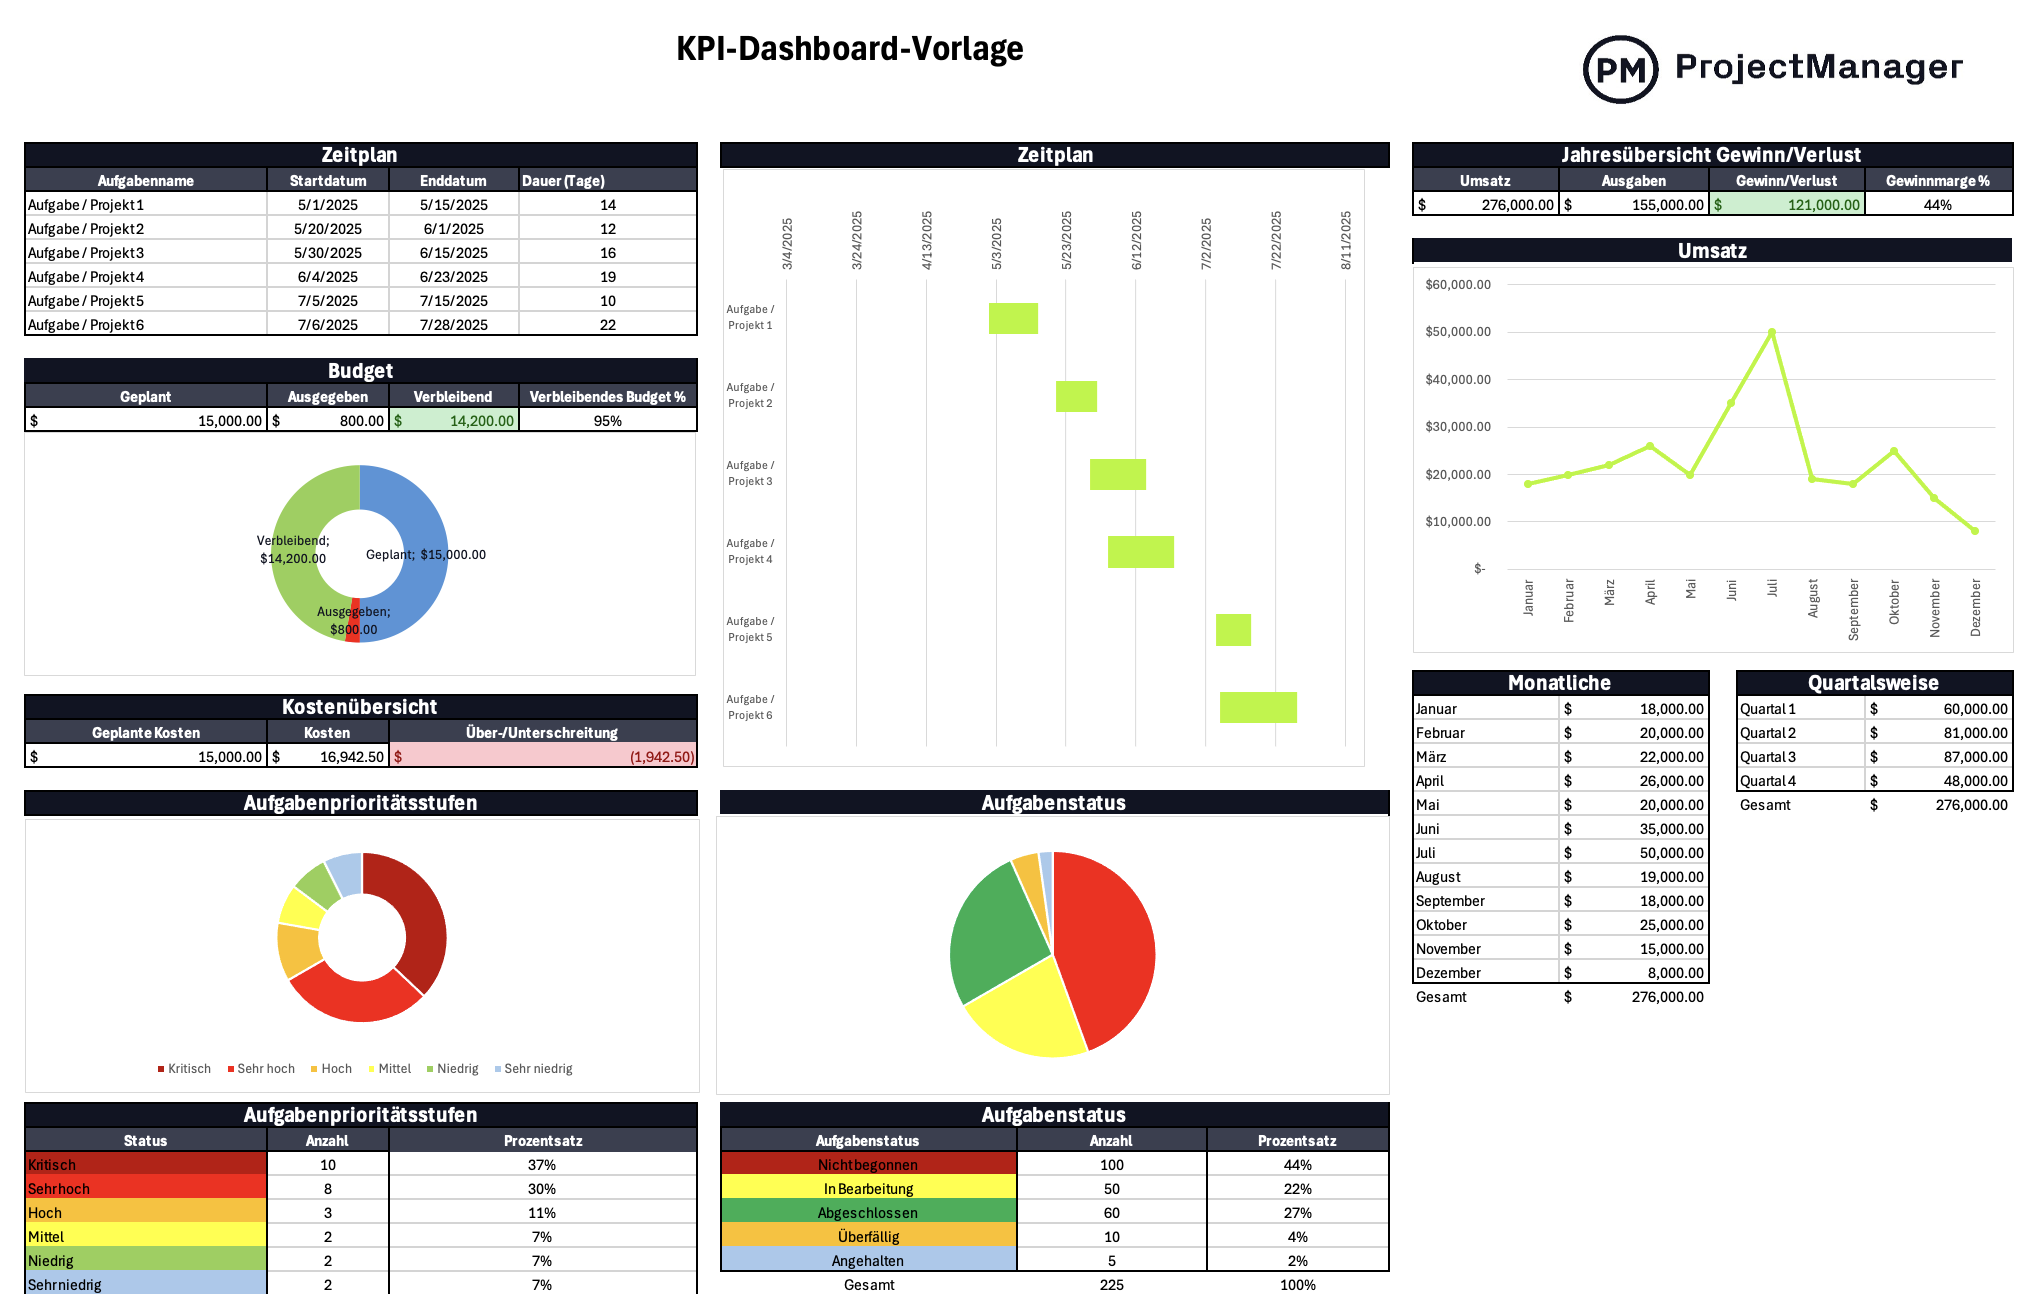
For organizations prioritizing overarching strategic metrics, the KPI-centric template delivers deeper analytical insights. Beyond tracking task completion, this iteration integrates financial tracking mechanisms, including annual profit-and-loss overviews split into revenue and expense trajectories. By breaking down financial flows into monthly and quarterly intervals, management teams can quickly ascertain their fiscal standing while simultaneously monitoring resource allocation. -
Dedicated Budget Dashboard
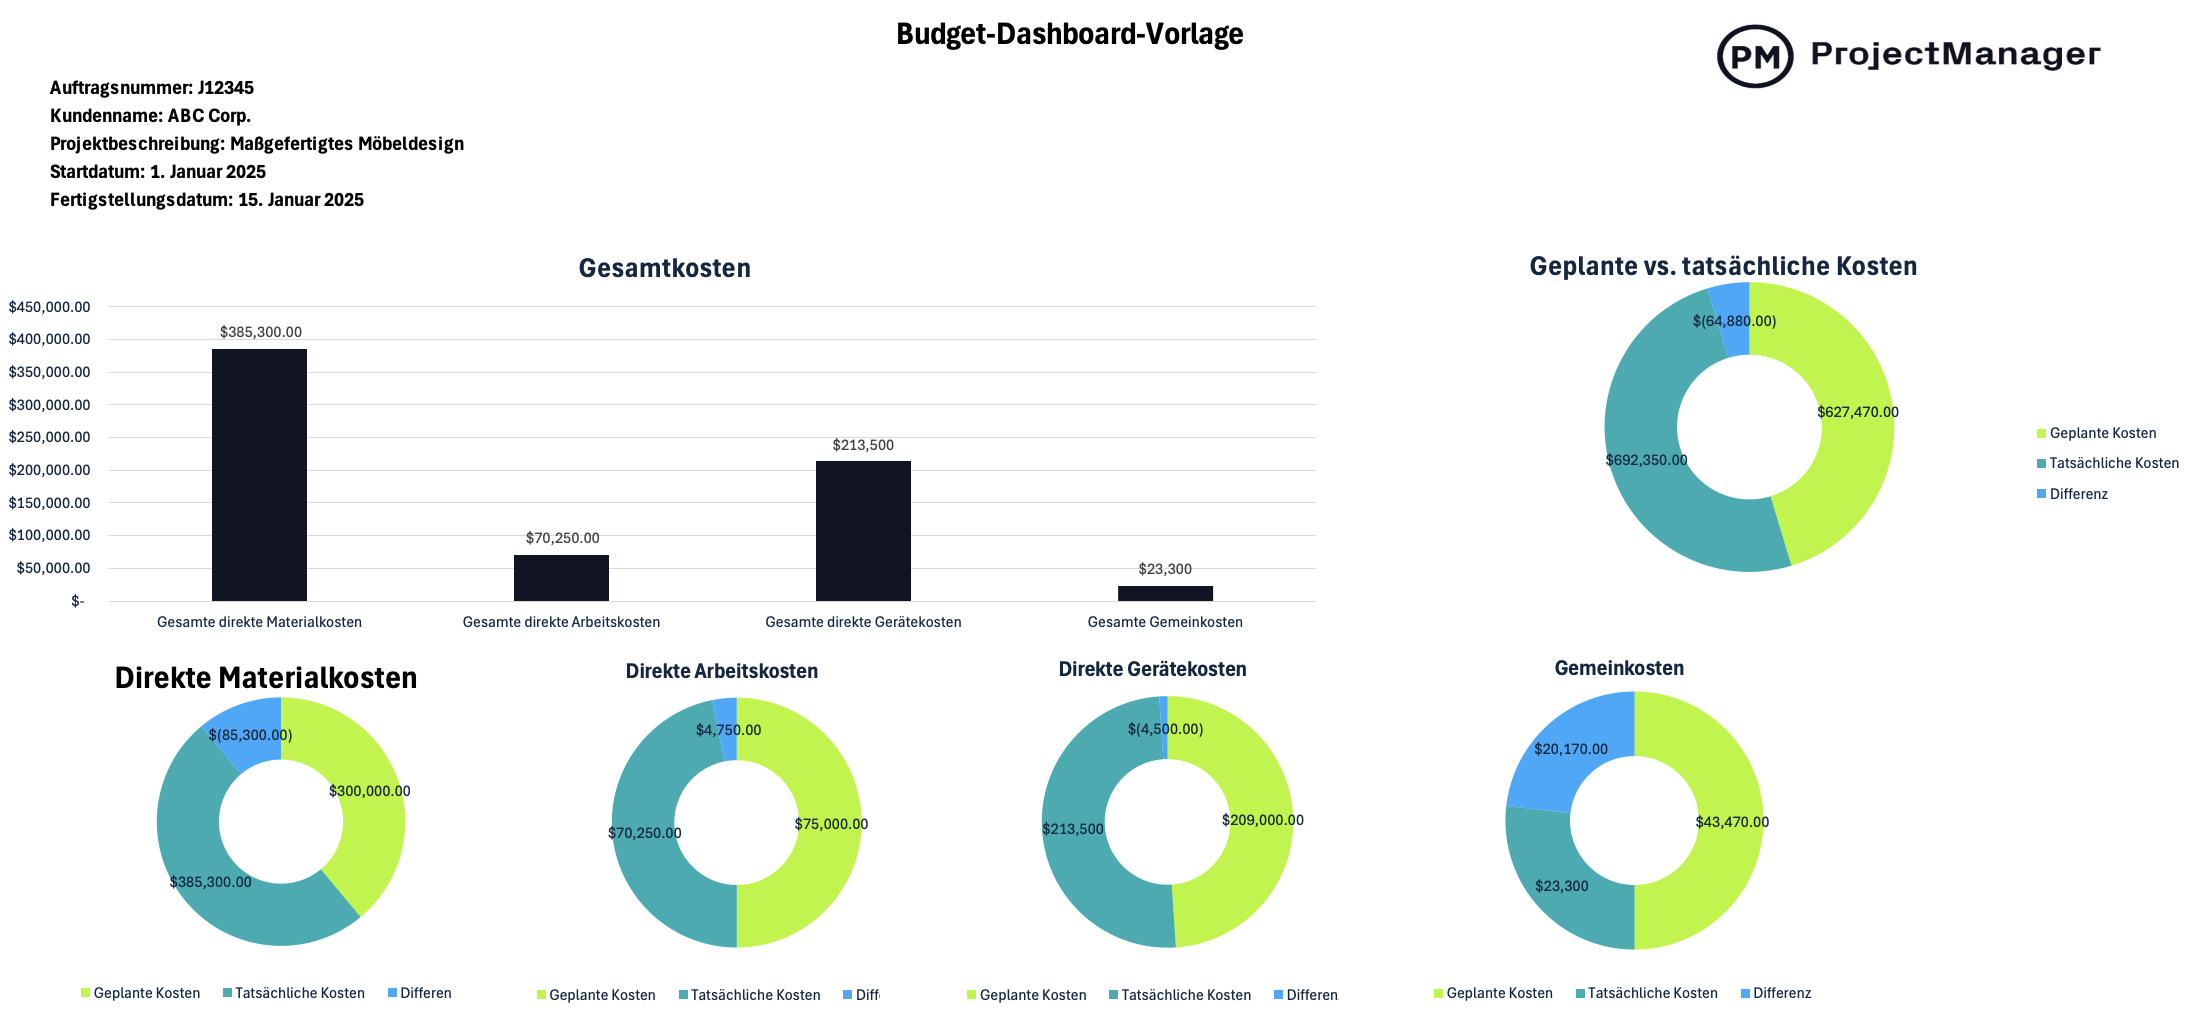
Financial oversight remains one of the most critical elements of successful project delivery. This specialized budget template provides a granular breakdown of project costs, incorporating fields for purchase order numbers, client identification, project descriptions, and milestone dates. Color-coded visual elements allow users to instantly compare planned expenses against actual outlays, categorizing costs across direct materials, direct labor, equipment usage, and general overhead. -
Task Tracker Dashboard
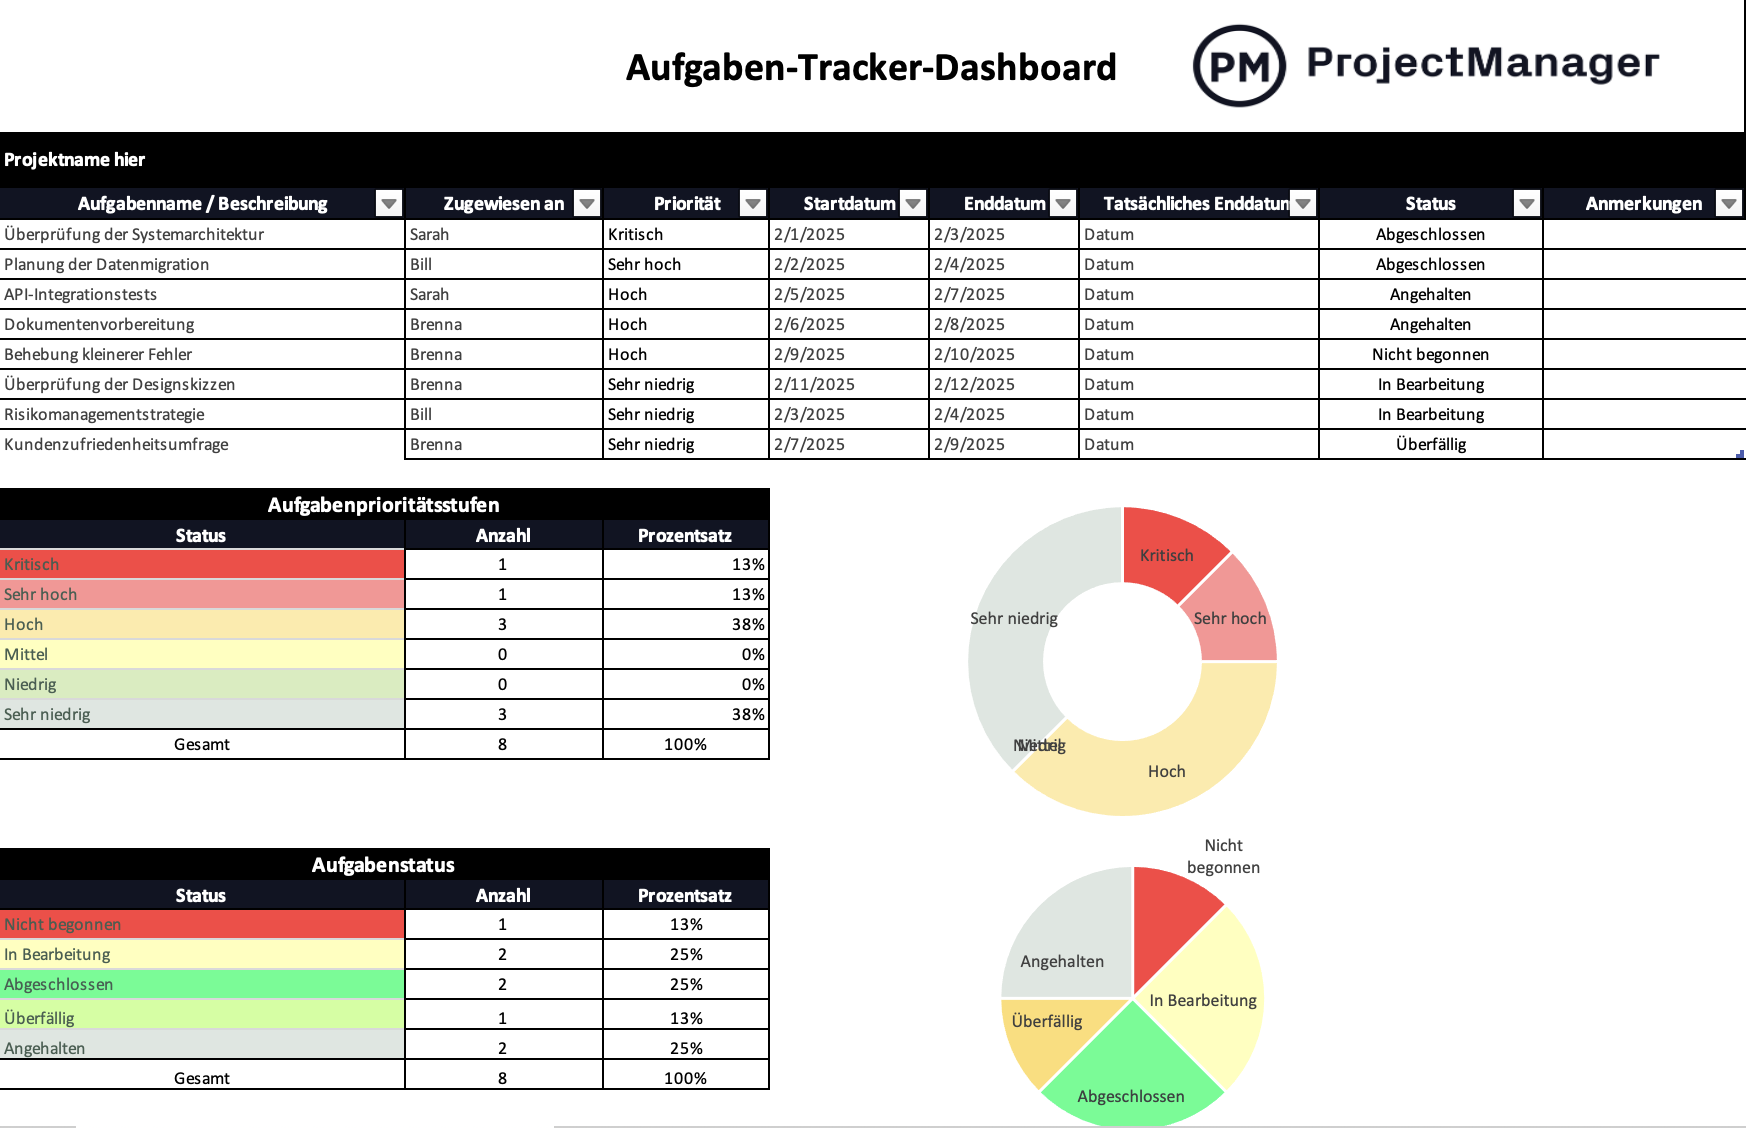
Operational execution depends on the granular monitoring of individual assignments. The task-tracking template functions as a centralized repository for daily project details, allowing managers to assign priorities ranging from low to critical, outline current statuses from pending to completed, and assign accountability. Visual percentage distributions help teams identify where blockades are forming within the workflow.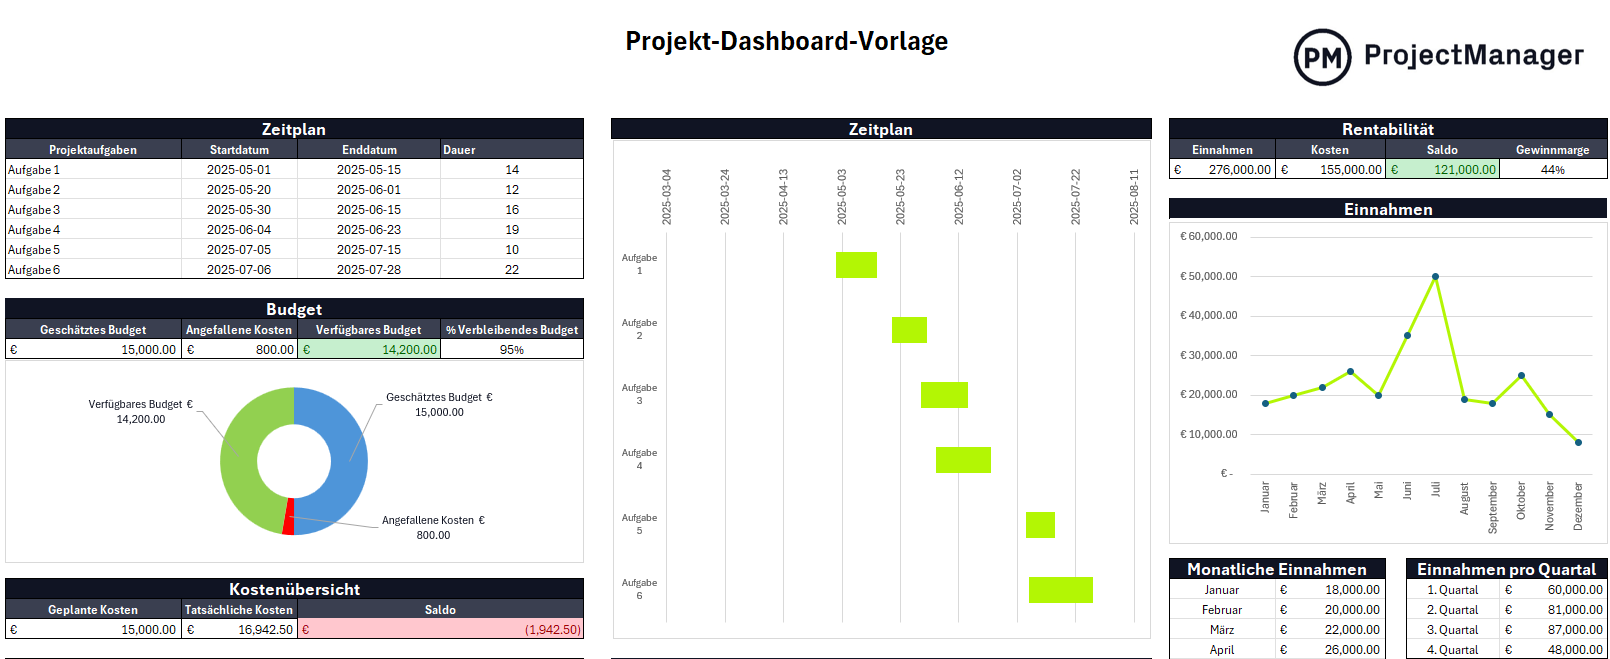
-
Asset Management Dashboard
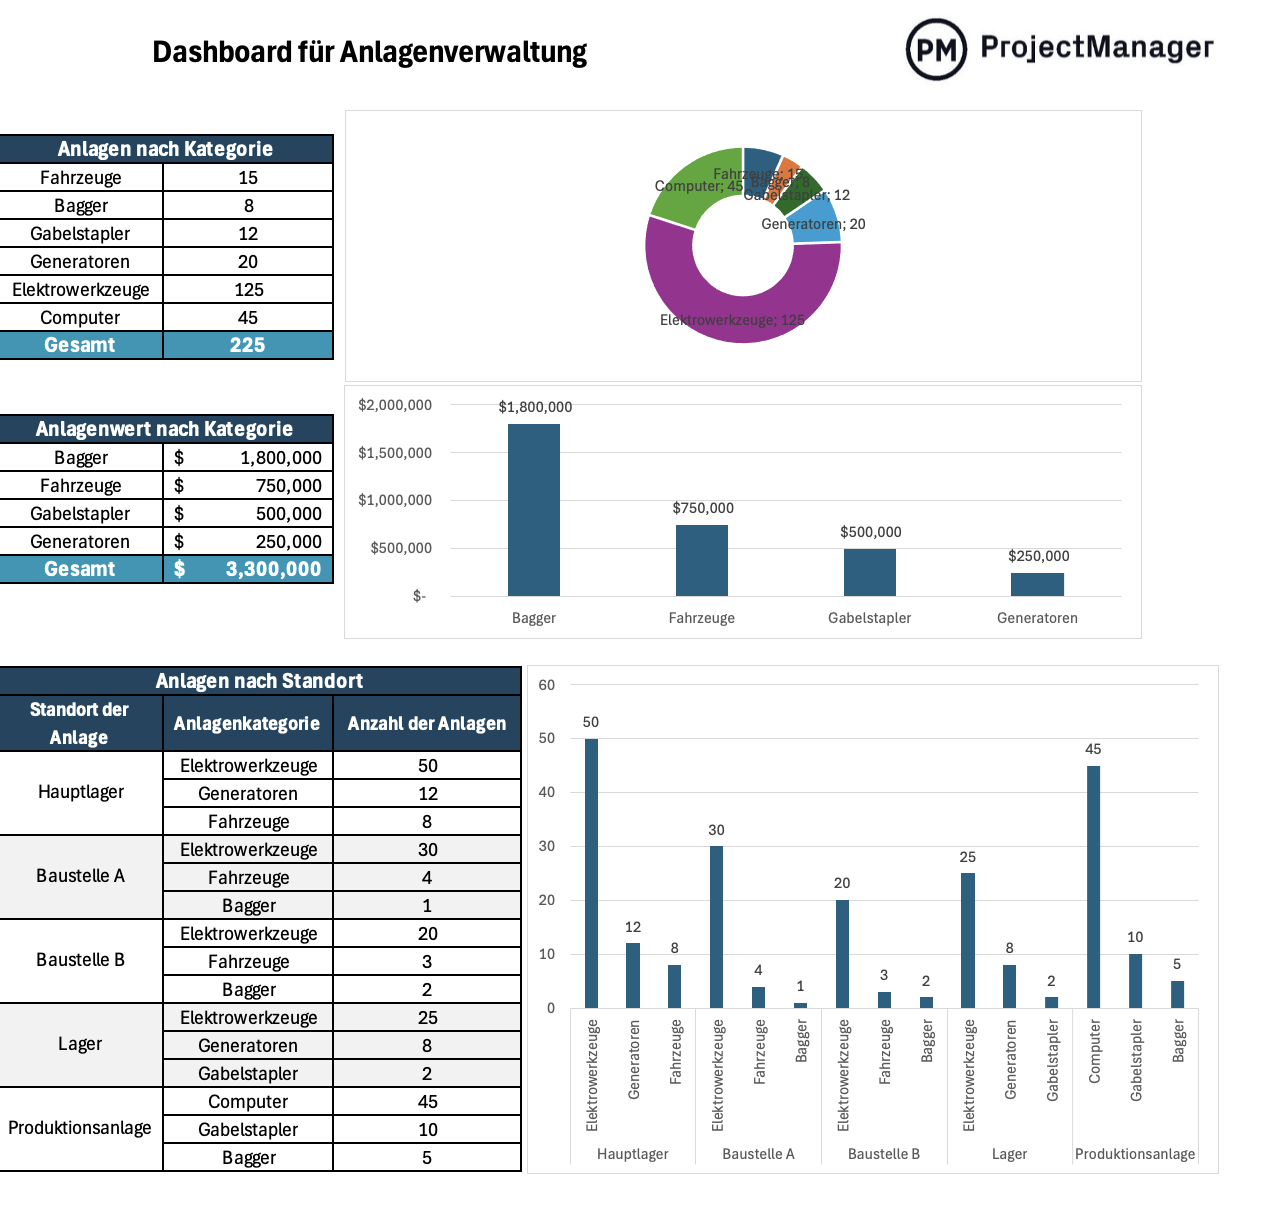
Beyond human resources and capital budgets, tracking physical inventory, tools, and equipment is essential for operational continuity. The asset management template consolidates inventory statistics, tracking quantities, valuations, and geographical distributions across various company sites. Donut charts and comparative bar graphs assist facilities and project managers in optimizing resource planning and scheduling preventive maintenance.
The Historical Evolution of Spreadsheet Tracking in Project Management
The reliance on spreadsheet software for project tracking dates back decades, evolving alongside personal computing. Before dedicated project management software became accessible and affordable for small-and-medium-sized enterprises, project coordinators relied exclusively on static tables and manually generated charts.

In the early stages of a project’s lifecycle, teams typically establish a work breakdown structure (WBS) and input milestones into a grid format. Historically, project managers updated these cells manually at the end of each workweek, compiling status reports for executive leadership. While this methodology successfully standardized data collection across industries, it introduced significant vulnerabilities. Manual data entry inherently risks human error, formulas can be accidentally broken or deleted, and static documents quickly become outdated in fast-paced operational environments.
Despite the introduction of real-time collaborative software in the 21st century, spreadsheets have maintained their relevance. Their universal adoption, low barrier to entry, and offline functionality ensure that millions of professionals continue to rely on grid-based systems for foundational data management.
Comparative Analysis: Static Templates Versus Real-Time Software Solutions
While free Excel templates provide an accessible entry point for basic administrative tracking, industry experts emphasize distinct operational differences between manual spreadsheet configurations and automated software platforms like ProjectManager.
Data Latency and Real-Time Visibility
The primary limitation of spreadsheet-based dashboards is their static nature. Data must be entered, verified, and updated manually. Conversely, modern cloud-based project management tools automatically ingest live data from team members as tasks are completed. This eliminates information lag, enabling managers to view up-to-the-minute metrics regarding project velocity and budget consumption.
Collaboration and Version Control
Excel templates often struggle with multi-user collaboration. Unless hosted on specialized cloud environments, local files passed via email frequently result in version control conflicts, where multiple team members edit divergent copies of the same document. Enterprise platforms offer centralized repositories with permission-based access, ensuring all stakeholders reference a single source of truth.
Advanced Scheduling and Resource Balancing
While an advanced Excel template can display static workloads or basic Gantt-like timelines, true project management software incorporates dynamic scheduling engines. Features such as critical path method (CPM) calculations, automated dependency mapping, and global holiday adjustments allow software to automatically recalculate project end dates when delays occur. Furthermore, resource management modules in dedicated platforms can flag team member over-allocation instantly, preventing burnout before it impacts project delivery.
Industry Perspective and Economic Implications
The ongoing coexistence of free templates and paid software reflects broader economic trends in corporate software acquisition. Many organizations—particularly startups, non-profits, and educational institutions—operate under constrained IT budgets that preclude widespread software licensing fees. For these entities, high-quality spreadsheet templates serve as vital operational stepping stones.
Conversely, large multinational corporations operating complex, multi-million-dollar portfolios require the robust data integrity, security compliance, and automated reporting offered by enterprise-grade solutions. Industry case studies indicate that firms transitioning from manual spreadsheets to automated project tracking often experience measurable improvements in resource utilization, schedule adherence, and financial forecasting accuracy.
Future Outlook for Project Data Visualization
As artificial intelligence and machine learning become increasingly integrated into enterprise software, the gap between static templates and dynamic dashboards is expected to widen further. Predictive analytics can now forecast potential project failures long before they manifest on a traditional bar chart, offering proactive mitigation strategies that manual spreadsheets cannot replicate.
Nevertheless, the availability of free, high-performance templates ensures that foundational project management remains accessible to anyone willing to organize their workflows systematically. Whether an organization chooses to utilize downloadable spreadsheet layouts for immediate administrative relief or invests in comprehensive real-time software to streamline global portfolios, the underlying principle remains unchanged: clear visualization of data is the cornerstone of operational success.