2018 Private SaaS Company Survey Results: Insights into Growth, Sales Strategies, and Capital Efficiency


For the seventh consecutive year, industry experts have released the comprehensive findings of the annual Private SaaS Company Survey, developed in collaboration with the KBCM Technology Group—formerly recognized as Pacific Crest Securities. Drawing insights from approximately 385 private Software-as-a-Service (SaaS) companies, this year’s report offers an unprecedented look into the operational metrics, growth trajectories, sales methodologies, and capital efficiencies defining the modern cloud-software ecosystem. As the enterprise technology landscape matures, data from these annual benchmarks serve as an indispensable compass for founders, venture capitalists, and executive leadership teams striving to navigate competitive markets.
Methodology Enhancements and the 2017 Dataset
A significant evolution marked the deployment of this year’s survey. Unlike previous iterations that largely relied on broad statistical ranges, the research team implemented a more rigorous data-collection methodology. Respondents were explicitly asked to provide precise numerical figures for critical performance indicators, including Annual Recurring Revenue (ARR), customer churn rates, and the granular attribution of sales and marketing expenditures.
This methodological shift enabled analysts to calculate 2017 metrics with pinpoint accuracy, eliminating the estimation margins inherent in bracketed data. The resulting dataset provides a remarkably clear window into how private SaaS enterprises performed during a pivotal period of technological scaling and market consolidation. The complete, unedited report remains accessible via the KBCM Technology Group resource library for researchers and financial analysts seeking deeper granularity.
Survey Demographics and Participant Composition
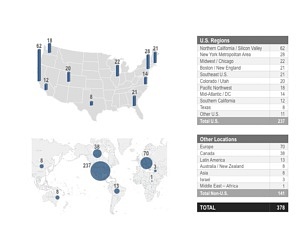
Understanding the macroeconomic and structural conclusions of the report requires examining the composition of the participating cohort. The 2017 survey captured responses from approximately 385 private SaaS entities distributed across diverse geographical footprints and developmental stages.
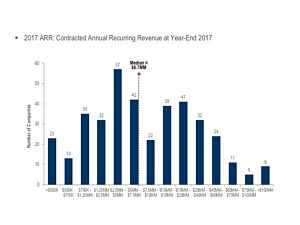
When categorized by scale—measured through ARR tiers—the participant pool reflected a healthy cross-section of the industry. Companies generating less than $5 million in ARR formed the largest segment with 160 respondents, illustrating the heavy concentration of early-stage startups contributing to the dataset. Mid-sized enterprises were robustly represented, with 65 respondents falling into the $5 million to $10 million ARR bracket, and 80 respondents operating within the $10 million to $25 million range. Scaling enterprises with revenues between $25 million and $50 million accounted for 47 participants, while mature private SaaS firms boasting over $50 million in ARR rounded out the upper tier with 33 respondents.
Geographically, the participant base predominantly reflected North American operational hubs, though international cloud providers also contributed. This distribution ensures that the benchmark statistics heavily mirror western venture capital dynamics, sales motions, and macroeconomic pricing pressures, while still offering broad applicability to global software enterprises.
Human Capital Efficiency and Productivity Metrics
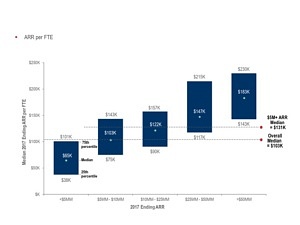
As venture capital markets increasingly emphasize sustainable growth over unbridled cash burn, human capital efficiency has emerged as a paramount metric for SaaS boards. The survey evaluated human resource productivity by analyzing ARR per Full-Time Equivalent (FTE) employee across various revenue scales.
Data from the 384 respondents detailing FTE efficiency revealed expected economies of scale. Early-stage startups typically exhibit lower revenue-per-employee ratios as they build out foundational engineering and initial sales teams. However, as companies cross revenue thresholds—particularly past the $25 million ARR mark—operational leverage becomes apparent. Automation, mature product-market fit, and streamlined customer success operations allow organizations to generate higher recurring revenue streams per head count, optimizing labor expenditures and extending operational runways.
Organic ARR Growth Rates and Scaling Realities
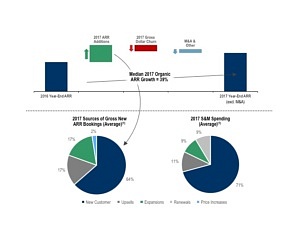
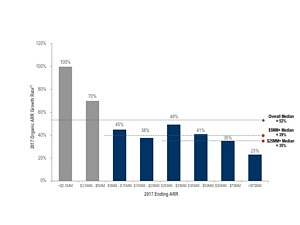
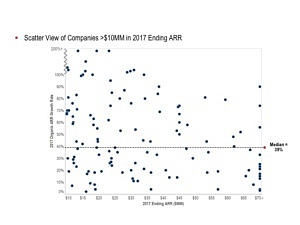
Organic Annual Recurring Revenue growth remains the ultimate litmus test for SaaS vitality. Excluding growth derived from mergers and acquisitions, the survey tracked the organic expansion rates of 261 respondents across distinct revenue bands.
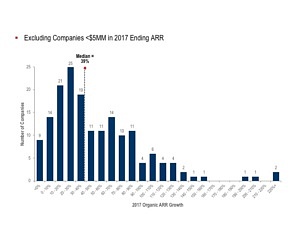
The findings underscore a fundamental law of corporate finance: hyper-growth becomes increasingly difficult to sustain as a company scales. The data presented a long, sparse "tail" for growth rates residing well above the median, highlighting that while outlier companies achieve extraordinary multi-hundred-percent expansion, the vast majority experience a predictable moderation in percentage growth as their revenue base expands.
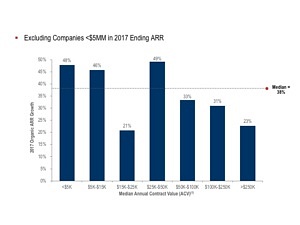
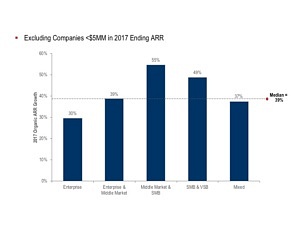
When examining median growth rates as a function of annual contract values (ACV) and target customer profiles, distinct patterns emerged among the 144 respondents who provided ACV breakdowns. Companies targeting enterprise clients—defined as organizations with more than 1,000 employees—frequently managed larger contract sizes, which fundamentally influenced their go-to-market strategies and capital consumption requirements. Conversely, firms focusing on small-to-medium businesses (SMBs) and very small businesses (VSBs) relied on high-volume, lower-ACV transactions, necessitating entirely different customer acquisition engines.

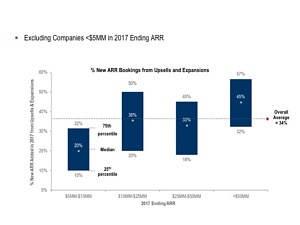
Furthermore, the research highlighted the heavy reliance that scaling SaaS companies place on upsells and expansions. For firms in the $10 million to $25 million and $25 million to $50 million ARR tiers, net revenue retention driven by existing customer expansion proved to be just as vital as new customer acquisition in driving overall top-line growth.
Go-To-Market Strategies: Field Sales vs. Inside Sales
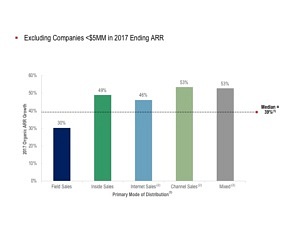
The mechanics of customer acquisition formed a core pillar of the 2017 survey. Software companies deployed varied distribution models—categorized into field sales, inside sales, internet/self-serve sales, and channel partnerships—depending on their product complexity and target buyer.
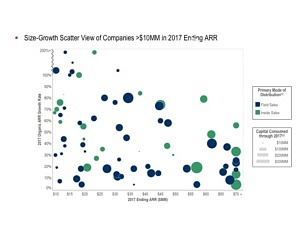
A primary mode of distribution was assigned only when a specific sales channel contributed to the greatest share of new sales and outperformed competing channels by at least 30 percentage points. Out of the participating cohort, field sales dominated among enterprises with larger ACVs, commanding substantial sales and marketing budgets. Meanwhile, inside sales models proved highly effective for mid-market and upper-SMB tiers, striking a balance between personalized engagement and cost efficiency.
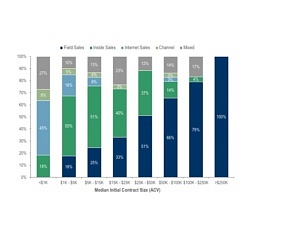
An analysis comparing field-dominated versus inside-dominated sales teams in crossover deal-size tiers provided fascinating insights into capital allocation. Field sales operations typically incurred significantly higher fully-loaded customer acquisition costs (CAC) due to travel, extended sales cycles, and higher base compensation packages. However, these costs were often justified by the substantially larger enterprise contract values secured. Conversely, inside sales teams demonstrated faster payback periods and lower initial capital requirements, making them the preferred engine for velocity-driven SaaS models.

Sales and Marketing Composition and Capital Efficiency
Understanding how SaaS companies allocate their sales and marketing (S&M) budgets is critical for evaluating operational health. The survey analyzed S&M expenditures relative to growth rates across 159 respondents, illustrating a direct correlation between aggressive spending and top-line expansion—provided the capital was deployed efficiently.
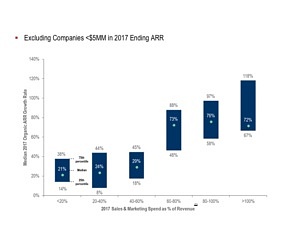
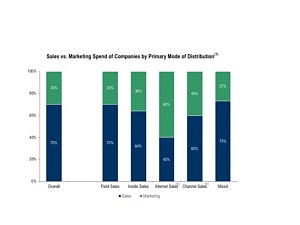
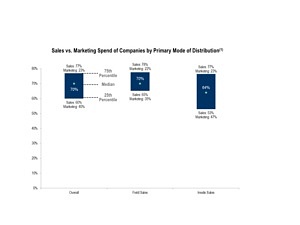
The composition of S&M costs revealed how organizations split expenditures between direct sales personnel and marketing initiatives. Companies utilizing internet and inside sales models naturally leaned more heavily into marketing automation, digital advertising, and inbound lead generation. In contrast, field-heavy organizations allocated the lion’s share of their budgets to direct sales compensation, commissions, and travel overhead.
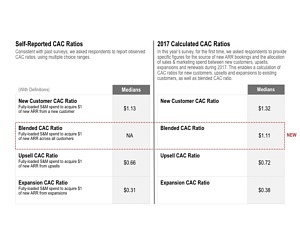
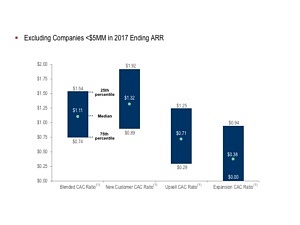
To bring analytical rigor to these observations, the survey compared self-reported CAC ratios against calculated CAC ratios. By dividing fully-loaded S&M spend by new ARR components (excluding churn), analysts uncovered discrepancies in how executives perceive their acquisition efficiency versus reality.
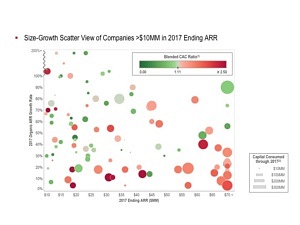
Capital consumed—defined as cumulative primary equity raised plus debt drawn, minus cash on the balance sheet—was cross-referenced with CAC and growth rates among 105 respondents. The data confirmed that capital-efficient SaaS companies maintained disciplined CAC payback periods, measured by the number of months of subscription gross profit required to recover the fully-loaded cost of acquiring a customer. For most successful respondents, gross-margin-adjusted CAC payback periods hovered within healthy historical benchmarks, ensuring that growth did not compromise long-term unit economics.
Broader Industry Implications and Future Outlook
The findings from the seventh annual Private SaaS Company Survey captured an industry in robust health, characterized by increasing financial transparency and structural maturity. By shifting to precise numerical data reporting, the 2017 survey established a higher standard for industry benchmarking.
The implications for founders and venture capitalists are clear. While rapid top-line growth remains the primary valuation driver in the SaaS sector, achieving that growth requires an acute alignment between product pricing, target customer demographics, and distribution channels. Companies that fail to optimize their sales efficiency or rely blindly on heavy capital consumption without corresponding net retention face mounting pressures from investors.
As private SaaS companies continue to evolve past 2018, the insights compiled by KBCM Technology Group and forEntrepreneurs will undoubtedly serve as foundational reference points. By adhering to disciplined unit economics, balancing field and inside sales motions, and closely monitoring human capital productivity, the next generation of cloud software leaders can successfully navigate the journey from early-stage startup to enterprise-scale durability.
Related posts: