Unveiling the 2018 Private SaaS Company Survey Part 2: Key Operational, Financial, and Growth Benchmarks for Industry Leaders


The release of Part 2 of the comprehensive private Software-as-a-Service (SaaS) company survey offers an unprecedented look into the operational frameworks, financial metrics, and strategic benchmarks defining the sector. Conducted in partnership between industry experts and the KBCM Technology Group—formerly recognized as Pacific Crest Securities—this marks the sixth consecutive year that the collaborative research initiative has provided vital performance metrics for private software enterprises navigating an increasingly competitive global marketplace. Following the initial rollout of Part 1, which heavily emphasized growth rates, go-to-market strategies, Customer Acquisition Cost (CAC) ratios, and payback periods, this second installment shifts its analytical lens toward foundational operational mechanics. These include subscription gross margins, application delivery infrastructure, sales commission structures, retention dynamics, capital efficiency, and adherence to the coveted "Rule of 40%." As private SaaS enterprises face mounting pressure to scale sustainably while balancing profitability, the latest data serves as an essential strategic compass for founders, chief financial officers, and venture capital investors alike.
A Retrospective Look at the Annual SaaS Survey Partnership
The genesis of this annual benchmark study traces back six years, establishing itself as the gold standard for private SaaS valuation and operational health. The partnership between KBCM Technology Group and leading entrepreneurial advisors was formed to bridge a critical informational gap in the software industry. Unlike public companies that are legally mandated to disclose granular financial metrics quarterly, private SaaS firms historically operated within an opaque ecosystem, making competitive benchmarking extraordinarily difficult. Over the years, the survey has evolved from a nascent regional project into a global benchmark instrument, aggregating data from hundreds of respondents representing diverse revenue tiers, geographic locations, and go-to-market motions. The 2018 edition continues this legacy, capturing real-world operational realities during a period defined by rapid technological maturation and shifting capital availability.
Shifting Infrastructures: SaaS Application Delivery Trends
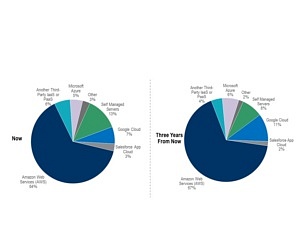
One of the most profound structural shifts highlighted in the Part 2 results centers on how software companies deliver their applications to end-users. The historical practice of maintaining self-managed, physical data centers has rapidly waned, superseded almost entirely by third-party cloud infrastructure providers. According to the survey data, an overwhelming 87% of participating companies rely predominantly on third-party cloud delivery networks. Within this dominant cohort, nearly three-quarters leverage Amazon Web Services (AWS) as their primary hosting environment.
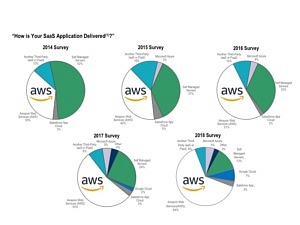
A longitudinal analysis of application delivery trends dating back to 2014 illustrates an uninterrupted migration toward cloud-native ecosystems. While Google Cloud and Microsoft Azure have begun capturing pockets of market share, particularly among enterprises seeking multi-cloud redundancies, AWS maintains a commanding lead. Interestingly, a granular breakdown of delivery modes as a function of company size reveals that self-managed servers are now almost exclusively utilized by the largest and oldest legacy vendors in the survey pool. Yet, even within this traditionally conservative segment, adoption rates for third-party platforms like AWS experienced notable year-over-year acceleration.

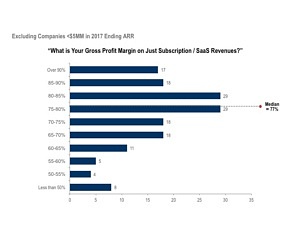
Crucially, the data indicates that median subscription gross margins do not vary significantly when filtered by the choice of SaaS application delivery method. Whether operating on AWS, Azure, or Google Cloud, the core cost of revenue remains tightly clustered, though secondary providers like Azure and Google displayed broader statistical distributions, largely attributable to smaller sample sizes.

Professional Services and Sales Compensation Dynamics
As SaaS companies scale upmarket to target larger enterprise clients, their operational expenditures and service models inevitably transform. The survey data examining professional services as a percentage of first-year Annual Recurring Revenue (ARR) confirms traditional industry intuition: firms with a strategic focus on large enterprises exhibit substantially higher professional services overhead. Large enterprise deployments routinely demand bespoke implementation, complex data migration, and dedicated customer success engineering, driving up initial deployment costs compared to standardized, self-serve SMB offerings.

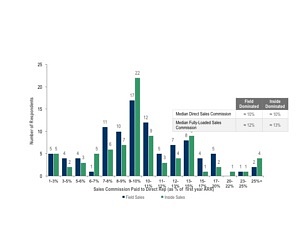
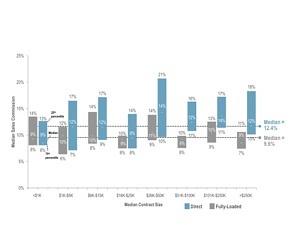
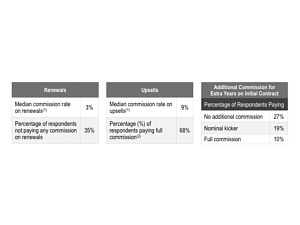
In tandem with service delivery, sales commission architectures remain a central focus for executive management aiming to optimize customer acquisition efficiency. When analyzing direct sales commissions across different sales motions, the 2018 survey reveals a surprising lack of divergence between organizations utilizing field sales versus those relying on inside sales teams. Direct sales and fully loaded commission rates remained remarkably consistent regardless of whether deals were closed remotely or via face-to-face field operations. Furthermore, an evaluation of commission rates against median contract sizes demonstrates stable compensation benchmarks across nearly all contract value tiers, ranging from sub-$1,000 agreements to enterprise contracts exceeding $250,000. When examining incentives for contract expansions, direct commissions for renewals, upsells, and securing multi-year commitments remain closely aligned with or occasionally exceed standard new-logo acquisition rates, underscoring the high strategic value placed on net revenue retention.
Cost Structures, Profitability, and the Rule of 40%
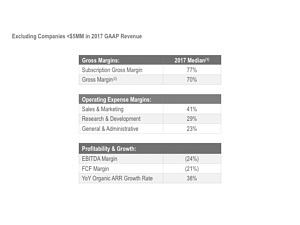
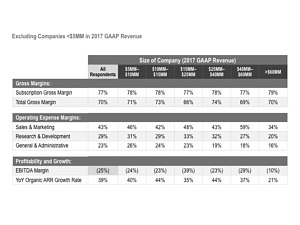
Understanding the delicate equilibrium between growth and profitability is vital for any SaaS enterprise seeking long-term viability. The survey’s deep dive into cost structures—adjusted for GAAP standards with stock-based compensation added back—reveals how median operating expenses scale alongside top-line revenue expansion. As companies progress from the $5 million ARR threshold up to mature stages exceeding $60 million, research and development (R&D) and sales and marketing (S&M) expenditures consume the lion’s share of operating capital before achieving sustainable economies of scale and positive free cash flow (FCF) margins.
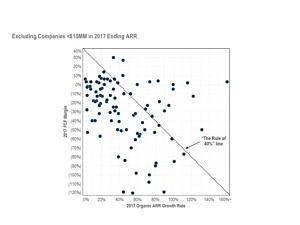
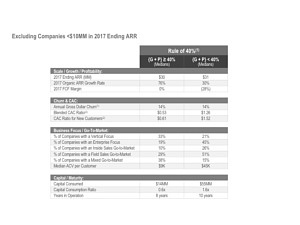
To evaluate overall health, the survey measured participants against the widely accepted "Rule of 40%," an industry benchmark dictating that a healthy software company’s combined growth rate and profit margin should equal or exceed 40%. The findings among private SaaS participants with over $10 million in ARR revealed a sobering reality: only about 20% (21 out of 106 respondents) met or exceeded the 40% threshold, with the median group posting a combined growth-plus-profitability score of +8%.
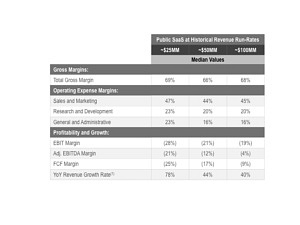
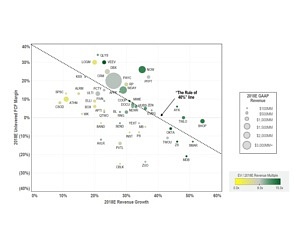
A comparative analysis between Rule of 40 qualifiers and their non-qualifying peers yields fascinating strategic insights. While top-tier performers share similar demographic profiles in terms of company age and scale, they consistently exhibit significantly lower Customer Acquisition Costs (CAC) and drastically reduced capital consumption ratios. Moreover, these high-performing outliers are notably more inclined to pursue vertical market strategies rather than broad enterprise-horizontal plays, enabling greater pricing power and lower churn. For contextual comparison, public SaaS companies surveyed during the same period boasted a median growth-plus-profitability score of 33%, with over 70% of total public SaaS market capitalization residing above the 40% threshold.
Contracting, Pricing, and the Evolution of Churn Metrics
Pricing architecture and contract longevity form the bedrock of predictable SaaS revenue generation. The survey highlights a clear correlation between contract value and duration: larger enterprise contracts command longer initial commitments, typically structured around multi-year agreements with annual or upfront billing frequencies. Conversely, lower-value transactions lean heavily toward monthly or annual recurring arrangements. In terms of primary pricing metrics, seat-based pricing remains the dominant model, though alternative metrics—such as usage volume, data consumption, storage capacity, and financial scale parameters—continue to gain traction among specialized B2B vendors.
Retention metrics underwent a crucial methodological refinement in the 2018 survey. Rather than relying on historical self-reported ranges, researchers calculated a precise median annual gross dollar churn rate of 13.2% for the preceding 2017 calendar year. Despite higher gross dollar churn figures resulting from this rigorous data collection methodology, calculated net dollar retention remained resilient, holding steady at a median of approximately 102%. This indicates that successful upsell and expansion motions effectively offset base customer attrition.
Further slicing the churn data reveals clear operational levers for mitigation. Annual gross dollar churn decreases noticeably as contract lengths increase, upfront professional services implementation expands, and median contract sizes scale upward. Furthermore, companies deploying field sales models reported lower median annual gross dollar churn rates compared to those relying exclusively on inside sales, internet-driven self-serve funnels, or mixed distribution channels, largely due to deeper stakeholder alignment during the initial sales cycle.
Capital Efficiency and the Strategic Deployment of Debt
Scaling a SaaS business requires substantial upfront capital investment, making capital efficiency a paramount metric for investors and founders alike. The survey tracked cumulative primary equity raised, net of debt drawn and adjusted for cash reserves on the balance sheet. Across the respondent pool, the median capital consumption ratio stood at roughly 1.5x for companies surpassing the $5 million ARR mark. Intriguingly, this capital intensity ratio remains remarkably sticky, showing no meaningful decline until companies achieve massive scale well beyond the $75 million ARR threshold.
To bridge funding gaps without enduring excessive equity dilution, a significant portion of mature private SaaS companies actively incorporate debt financing into their capital structures. Among respondents utilizing at least $1 million in debt, credit facilities provide vital operational runway, supplementing primary venture capital and supporting aggressive go-to-market expansions.
Implications and Strategic Takeaways for Industry Stakeholders
The release of the 2018 KBCM Technology Group and SaaS Capital survey results provides a comprehensive roadmap for private software companies aiming to optimize their operational performance. By benchmarking critical vectors—such as the near-universal reliance on cloud infrastructure like AWS, the nuances of sales commission management, the economic realities of professional services, and the strict performance standards demanded by the Rule of 40%—executives are better equipped to navigate the complexities of modern software scaling. As market expectations continue to prioritize capital efficiency alongside top-line expansion, adhering to these empirical benchmarks will remain a definitive competitive advantage for the next generation of SaaS market leaders.