Unlocking Operational Efficiency: The Strategic Role of SIPOC Diagrams in Business Process Improvement


Process mapping is an indispensable practice for organizations seeking to understand and optimize their operational workflows, creating significant value by providing clarity on the business context of various tasks. Among the array of tools available for this purpose, the SIPOC diagram stands out as a fundamental technique, widely recognized for its ability to offer a high-level, end-to-end view of any given process. This visual mapping tool, originating from the Six Sigma methodology, has become a cornerstone in continuous improvement initiatives across diverse industries, from small business operations to complex civil engineering projects. Its utility lies in its capacity to illuminate the big picture, identify key stakeholders, and facilitate more effective planning, particularly when processes are slated for change or optimization.
Understanding the SIPOC Framework
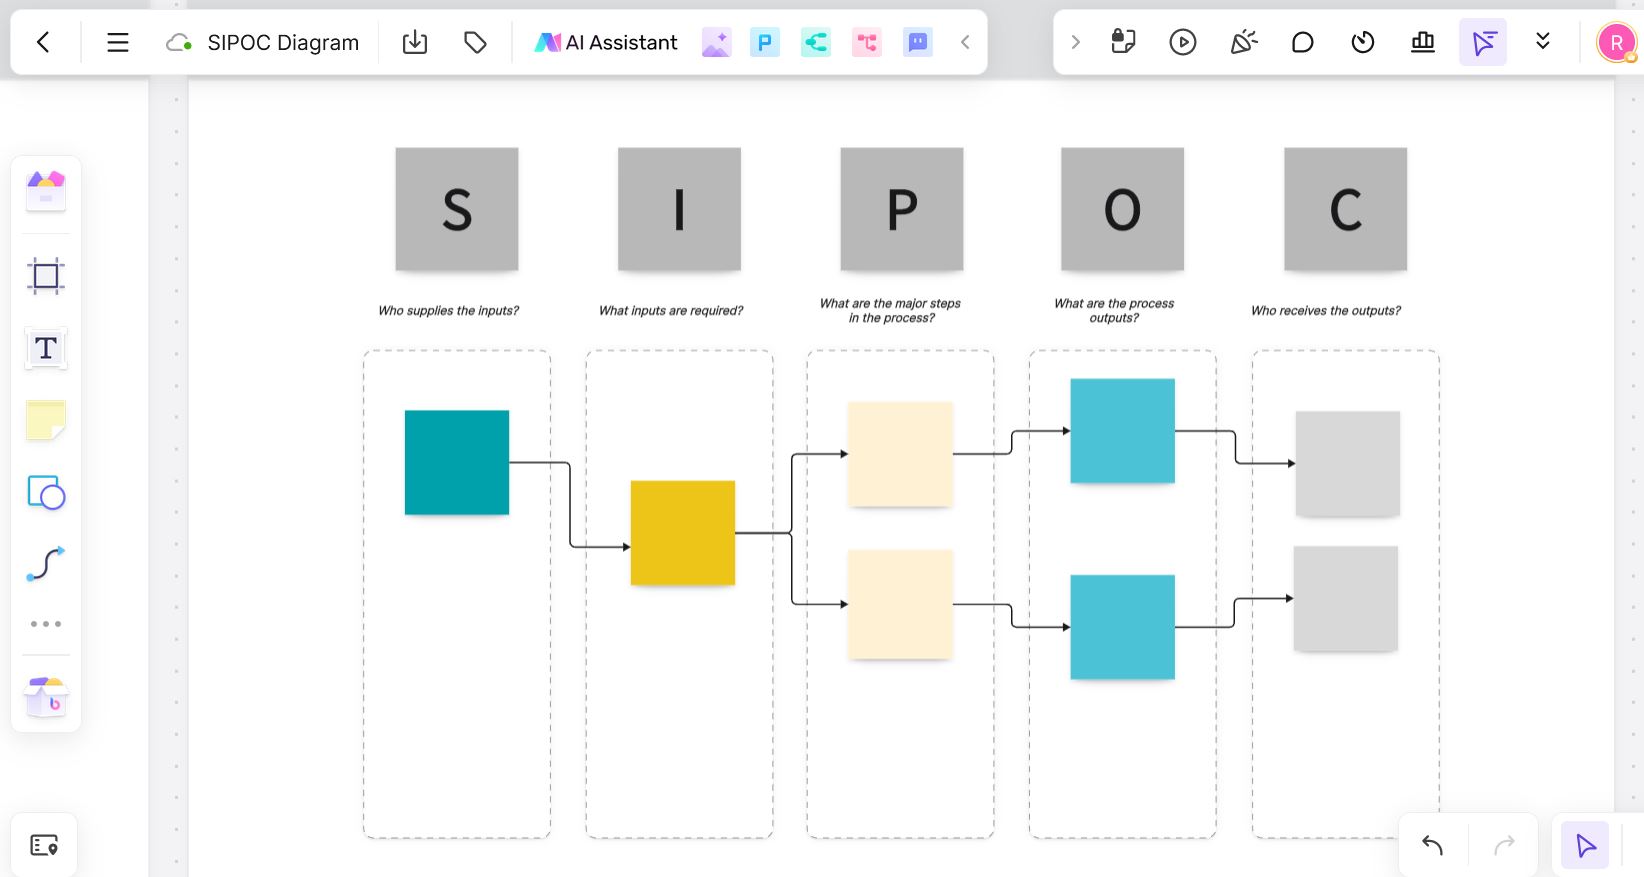
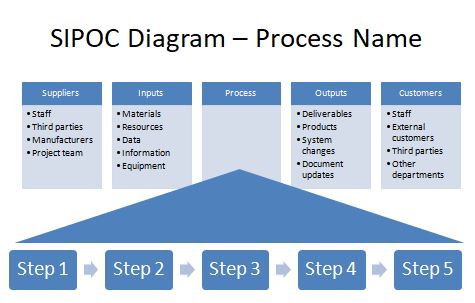
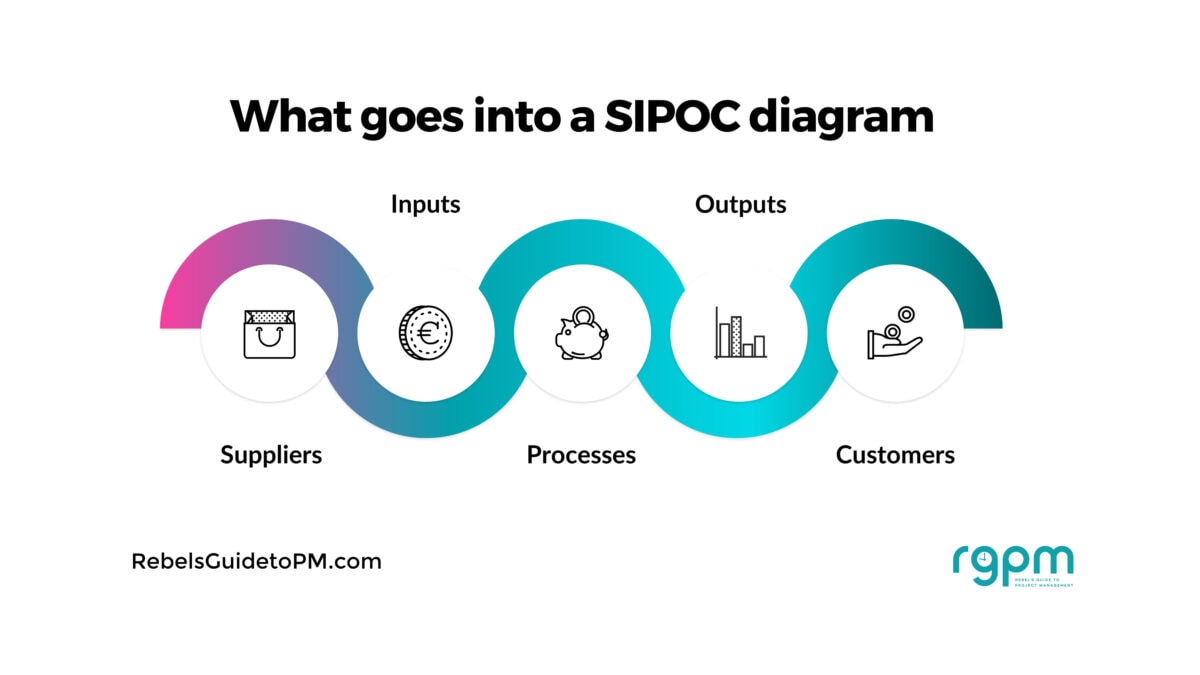
A SIPOC diagram, pronounced "sigh-pok," is an acronym representing five critical elements: Suppliers, Inputs, Process, Outputs, and Customers. It serves as a concise, visual method for documenting and analyzing a business process from its inception to its conclusion. This structured approach helps teams achieve a shared understanding of a process before delving into more intricate details, ensuring alignment and a common baseline for improvement efforts. The resulting diagram presents the process at a macro level, making it an ideal starting point for process analysis and stakeholder communication.
The Five Core Elements of a SIPOC Diagram
Each component of the SIPOC framework plays a vital role in comprehensively defining a process:
-
Suppliers: This segment identifies all entities that provide the necessary resources, information, or materials for the process to commence. Suppliers can be internal departments, external vendors, or even customers themselves if they provide initial data or requests. For instance, in a website account registration process, suppliers might include the web hosting company, the marketing department providing user acquisition data, or even the user providing their personal details. Identifying suppliers is crucial for understanding where inputs originate and ensuring their quality and timely delivery. In project management contexts, these are often aligned with key project stakeholders whose contributions are essential.

-
Inputs: Inputs are the tangible or intangible items required for the process to function and generate an output. These can range from raw materials and data to specific information, regulatory guidelines, or technological environments. Continuing with the website registration example, inputs would encompass customer names, email addresses, credit card details (if applicable), and any other data points necessary for account creation. It is critical to consider both internal and external inputs, recognizing dependencies on other teams or external systems, to prevent potential bottlenecks or data gaps. A thorough listing of inputs helps in assessing resource needs and potential points of failure.
-
Process: This is the core sequence of high-level activities that transform inputs into outputs. Unlike a detailed flowchart, a SIPOC diagram typically outlines five to seven major steps, providing a generalized overview rather than an exhaustive step-by-step breakdown. This "Level 1" process mapping ensures clarity on the overall flow without getting bogged down in granular operational specifics. For the website registration process, high-level steps might include "User provides details," "System validates information," "Account created," "Confirmation sent," and "Data stored." The objective here is to ensure all team members grasp the fundamental progression of events and agree on the scope of the process being analyzed.
-
Outputs: Outputs are the direct results or deliverables produced by the process after the inputs have been transformed. These are what the customer ultimately receives or what the subsequent process utilizes. In the website registration scenario, outputs would include a new customer account, a confirmed registration status, an email notification to the user, and potentially a new marketing lead for the sales team. Identifying outputs helps to define the purpose and value generated by the process, linking directly to customer satisfaction and organizational objectives.

-
Customers: This final component identifies the recipients of the process’s outputs. Customers can be internal (e.g., other departments, employees) or external (e.g., end-users, clients, third-party partners). For the website registration, the primary customer is the end-user who gains an account, but internal teams like sales and marketing are also customers, utilizing the newly acquired customer data. This step is particularly insightful as it compels teams to consider the "voice of the customer" and align process design with their expectations and needs. Often, challenging the initial perception of who the "true" customer is can lead to a more holistic understanding of process impact. Adding customer requirements or key success criteria to this section further enhances the diagram’s utility.
Historical Context and Methodological Integration
The SIPOC diagram gained prominence as a foundational tool within the Six Sigma methodology, particularly during the "Define" phase of its DMAIC (Define, Measure, Analyze, Improve, Control) framework. Six Sigma, developed by Motorola in the 1980s and popularized by General Electric in the 1990s, is a data-driven approach to eliminating defects and improving quality by minimizing variation in processes. SIPOC diagrams help to clearly delineate the boundaries and scope of a process being improved, providing a common understanding before measurement and analysis begin.
While rooted in Six Sigma, SIPOC’s straightforward nature has led to its adoption in Lean manufacturing, continuous improvement projects, and general business process management. Lean principles focus on eliminating waste and maximizing value; a SIPOC diagram aids this by clearly showing where value is created and where potential waste might occur between process steps. Its versatility means that one does not need to be a Six Sigma Black Belt to effectively utilize it for process review, gap identification, or any initiative aimed at enhancing operational efficiency.
Applications and Tangible Benefits
The strategic deployment of SIPOC diagrams offers numerous advantages for organizations across various sectors:
- Establishing a Common Understanding: By visually mapping the process, SIPOC ensures all stakeholders, regardless of their departmental background, share a consistent view of how the process operates. This reduces misunderstandings and fosters collaborative problem-solving.
- Defining Process Scope: It clearly delineates the start and end points of a process, preventing "scope creep" and ensuring improvement efforts remain focused.
- Identifying Key Stakeholders: The diagram highlights all individuals and groups involved as suppliers or customers, facilitating communication and engagement.
- Pinpointing Potential Issues: By visualizing the flow, teams can more easily identify areas where inputs might be inadequate, processes inefficient, or outputs misaligned with customer needs.
- Facilitating Change Management: Before implementing process changes, a SIPOC diagram serves as a baseline, allowing teams to appreciate the full impact of proposed modifications and communicate them effectively.
- Enhancing Communication: Its concise, visual format is ideal for presentations, training, and quick reference, making complex processes accessible to a broader audience.
- Driving Continuous Improvement: As a foundational step in quality management and process re-engineering, SIPOC sets the stage for more detailed analysis and targeted interventions. Industry reports frequently underscore that organizations with well-defined and mapped processes achieve significantly higher rates of operational efficiency and customer satisfaction.
For instance, a manufacturing company using SIPOC to analyze its assembly line can identify external suppliers providing faulty components (leading to quality issues), or internal departments causing delays in material delivery (affecting throughput). A healthcare provider might use it to map patient intake, identifying bottlenecks in information flow (inputs) or redundant steps (process) that impact patient experience (customer).
Implementation Strategies and Best Practices
Creating an effective SIPOC diagram is ideally a collaborative effort. A workshop-style setting, involving key team members and relevant stakeholders, is often the most productive approach. This ensures diverse perspectives are incorporated, leading to a more accurate and comprehensive representation of the process.
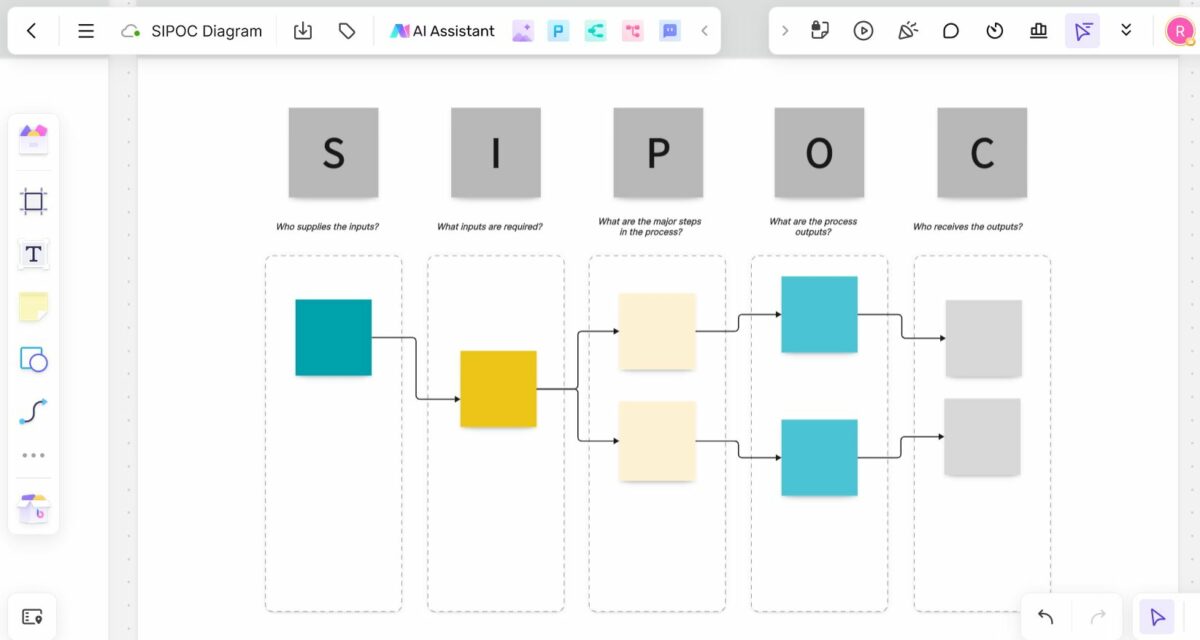
- Start with the Process: While the acronym begins with "Suppliers," many practitioners find it easier to start by defining the central "Process" steps first, as this often clarifies the scope.
- Work Backwards and Forwards: Once the process is outlined, identifying "Outputs" and then "Customers" (working forwards) can be more intuitive. Subsequently, working backward from the process to define "Inputs" and then "Suppliers" often provides clearer context.
- Keep it High-Level: Resist the urge to dive into excessive detail. The SIPOC diagram is meant for a macro view. If too many steps or inputs are identified, it may indicate the need to break down the main process into sub-processes.
- Focus on Key Elements: For each category, list only the most critical elements to maintain clarity and conciseness.
- Utilize Visual Aids: Whether using a whiteboard, digital collaboration tools like Miro or Mural, or presentation software, leveraging visual layouts helps facilitate discussion and understanding. Templates, often available in common business applications like PowerPoint or Excel, can provide a head start. While tools like Visio offer sophisticated charting capabilities, even a simple table in Word can effectively capture the SIPOC elements.
- Iterate and Validate: The initial SIPOC diagram should be considered a draft. It should be reviewed and validated by all involved stakeholders to ensure accuracy and consensus.
Limitations and Broader Implications
Despite its widespread utility, the SIPOC model has inherent limitations. Its strength as a high-level overview also means it lacks the granularity required for detailed operational instructions or in-depth root cause analysis. For complex processes, a single SIPOC diagram may not suffice; breaking down the process into sub-processes, each with its own SIPOC, or transitioning to more detailed flowcharts and process maps, becomes necessary. This simplicity, while beneficial for initial understanding, can be a drawback when attempting to diagnose specific performance issues or design intricate solutions.
Nonetheless, the SIPOC diagram serves as an excellent starting point for any process improvement journey. It acts as a bridge, connecting the strategic objectives of process mapping with the tactical steps of operational analysis. By fostering a foundational understanding of how work flows through an organization, it empowers teams to identify opportunities for enhancement, streamline operations, and ultimately deliver greater value to customers. Its continued relevance in an increasingly complex business landscape underscores the enduring power of clear, collaborative, and structured approaches to understanding and optimizing organizational processes.
Related posts: