The Pacesetter Index: ICONIQ Replaces Enterprise Five Scorecard to Define the New Financial Reality of AI-Driven Startups

The venture capital and enterprise software landscapes have undergone a profound structural evolution over the past several years, driven largely by the proliferation of artificial intelligence. In response to these sweeping shifts, investment firm ICONIQ has officially released The Pacesetter Index, a comprehensive benchmark report that succeeds its former Enterprise Five Scorecard. Designed to capture the actual growth rates, operational efficiencies, and financial metrics of elite venture-backed startups, the index pivots away from historical averages to focus exclusively on top-performing companies that are capturing the attention of the modern venture capital ecosystem.
The dataset underpinning the index draws from a rigorous synthesis of financial and operating figures spanning from 2024 through the second quarter of 2026. The underlying pool of analysis incorporates top-tier public software companies alongside ICONIQ’s proprietary portfolio of private venture and growth-stage enterprises. To filter out the noise of the broader market and isolate true outliers, ICONIQ applied a strict qualification threshold: companies must be classified as "Pacesetters," defined explicitly as businesses achieving top-quartile revenue growth over a trailing three-year period while simultaneously operating as AI-native or AI-driven entities.
By raising the analytical bar, the index offers an unvarnished look at how modern software businesses scale, spend, and retain customers in an era defined by rapid technological disruption and compressed market cycles.
Redefining Growth at Scale: The 115% Median at $100 Million ARR
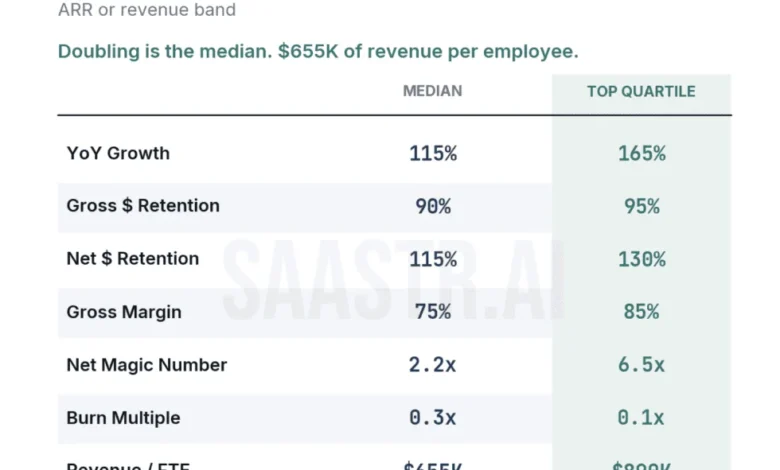
For over a decade, the aspirational trajectory for business-to-business (B2B) software companies was defined by the legendary "triple, triple, double, double, double" rule—a benchmark that most startups inevitably missed. However, data from The Pacesetter Index reveals that the growth paradigm at scale has shifted dramatically. Among companies generating over $100 million in Annual Recurring Revenue (ARR), the median growth rate now sits at an astonishing 115%, with the top quartile reaching 165%.
Historically, growth decay was a predictable mathematical certainty. Startups would predictably slow down as they expanded, transitioning from 300% growth to 150%, then 90%, and eventually 60%. In contrast, AI-native Pacesetters are demonstrating an entirely novel behavioral pattern: accelerating or sustaining hyper-growth deep into their maturity lifecycle. By securing usage-based expansion revenue at unprecedented velocities, these companies are actively bending the traditional decay curve upward, proving that massive scale no longer precludes hyper-expansion.
Early-Stage Velocity: Sub-$10M ARR Surges to a 900% Median
At the earliest stages of the startup lifecycle, the metrics recorded in the index border on the anomalous. For companies operating under $10 million in ARR, the median growth rate registered at a staggering 900%, while top-quartile performers achieved a jaw-dropping 2600% expansion rate.
While market observers frequently attribute such figures to small-number mathematics—such as transitioning rapidly from a modest baseline of $400,000 to $4 million through a handful of key enterprise design partners—the underlying distribution reflects a fundamental shift in early-stage traction. In 2023, a sub-$2M ARR company growing at 200% was widely considered an exciting and highly fundable proposition. Within the cohort captured by the Pacesetter Index, such performance falls well below the median. Consequently, the threshold for what constitutes a high-velocity seed or Series A investment has escalated significantly faster than the requirements for mature enterprises.
The Erosion and Recovery of Gross Margins
One of the most sacred doctrines of traditional SaaS investing was the inviolable 80% gross margin rule. For years, financial analysts maintained that any software company operating below 75% to 80% gross margins was fundamentally operating a low-margin services business disguised behind a user login. The Pacesetter Index demonstrates that this rule has been decisively upended by the realities of AI infrastructure.
According to the index, the median gross margin for Pacesetters with under $10 million in ARR sits at 55%, ticking up modestly to 60% for the $10 million to $25 million cohort. This compression is driven heavily by the immense computational overhead and inference costs associated with running foundational AI models. Rather than treating low initial margins as a disqualifier, modern venture capital diligence focuses heavily on the recovery trajectory.

As companies scale through the $25 million to $100 million ARR band, gross margins aggressively rebound toward 75% and 80%. This recovery is typically achieved through infrastructure optimization, favorable enterprise contract repricing, and a strategic shift toward workload mixes that generate higher net value relative to their compute consumption.
Gross Retention Realities in the Age of Frictionless Switching
While Net Revenue Retention (NRR) has historically dominated investor discussions, the Pacesetter Index introduces Gross Dollar Retention (GDR) as a critical metric for evaluating operational health at scale. The findings reveal a sobering trend: for companies surpassing $100 million in ARR, the median GDR falls to 90%, meaning that even the best-performing enterprises experience a 10% annual attrition of their existing revenue base.
This structural leak is the direct byproduct of a hyper-competitive, high-velocity market environment. The same technological efficiencies that enable AI-native startups to land enterprise accounts within weeks also allow competitors to poach those exact accounts with equal ease. Shortened sales cycles, rapid proof-of-concept (POC) deployments, and frictionless switching tools have combined to put existing revenue streams at heightened risk. Startups boasting high NRR figures driven entirely by expansion within a volatile customer base must now contend with closer scrutiny regarding the underlying stability of their foundational accounts.
Burn Multiples and Capital Efficiency Through the Growth Lifecycle
Capital allocation efficiency remains a central pillar of venture evaluation, yet the Pacesetter Index highlights a temporary deterioration of burn multiples during the mid-stage scaling phase. The median burn multiple sequence across revenue tiers progresses from 1.3x for early-stage ventures, spikes to 1.8x in the $10 million to $25 million ARR band, and subsequently compresses to 0.9x and 0.3x as companies scale past $25 million and $100 million, respectively.
The $10 million to $25 million band represents a notoriously expensive proving ground. During this transitional phase, startups are simultaneously funding aggressive go-to-market (GTM) expansions and heavy AI compute investments before either mechanism has achieved optimal operating leverage. However, once companies break past this threshold, capital efficiency recovers rapidly. Top-quartile Pacesetters at scale achieve a remarkable 0.1x burn multiple, effectively generating a dollar of new ARR for a fraction of historical burn costs.
Extreme Operating Leverage: Revenue Per Employee Surpasses Historical Benchmarks
Perhaps the most definitive financial signature of the AI era documented in the index is the dramatic expansion of revenue per full-time employee (FTE). Historically, a strong benchmark for enterprise software companies hovered between $200,000 and $250,000 in revenue per employee, with elite performers occasionally reaching $300,000.
The Pacesetter Index shatters these historical norms. The median Pacesetter generating over $100 million in ARR achieves an astounding $655,000 in revenue per employee, while top-quartile firms push this figure to $890,000. To contextualize this operational leverage, a $200 million ARR company operating at the median benchmark requires approximately 305 employees, whereas the same revenue generated under legacy per-employee frameworks would necessitate an 800-person workforce. This dramatic reduction in headcount requirements illustrates how AI tooling is fundamentally redefining corporate labor models.
Implications for Founders, Investors, and Market Dynamics
The publication of The Pacesetter Index serves as both a roadmap and a cautionary tale for the technology sector. While the headline figures highlight unprecedented growth velocities and extraordinary capital efficiency at scale, they also expose underlying vulnerabilities related to customer retention, margin volatility, and premature GTM scaling.
Particularly noteworthy is the index’s warning regarding artificially inflated Net Magic Numbers—such as a 7.7x multiple observed in early-stage cohorts—which often mask a dangerous underinvestment in foundational sales infrastructure rather than genuine operational brilliance. As the venture capital community absorbs these benchmarks, founders navigating the current funding environment must align their internal operational metrics not with historical SaaS averages, but with the accelerated realities of the modern AI-native economy.