Stack Overflow Co-Founder Jeff Atwood Challenges Public Perception of Economic Disparity with Interactive Digital Project Dream Again USA

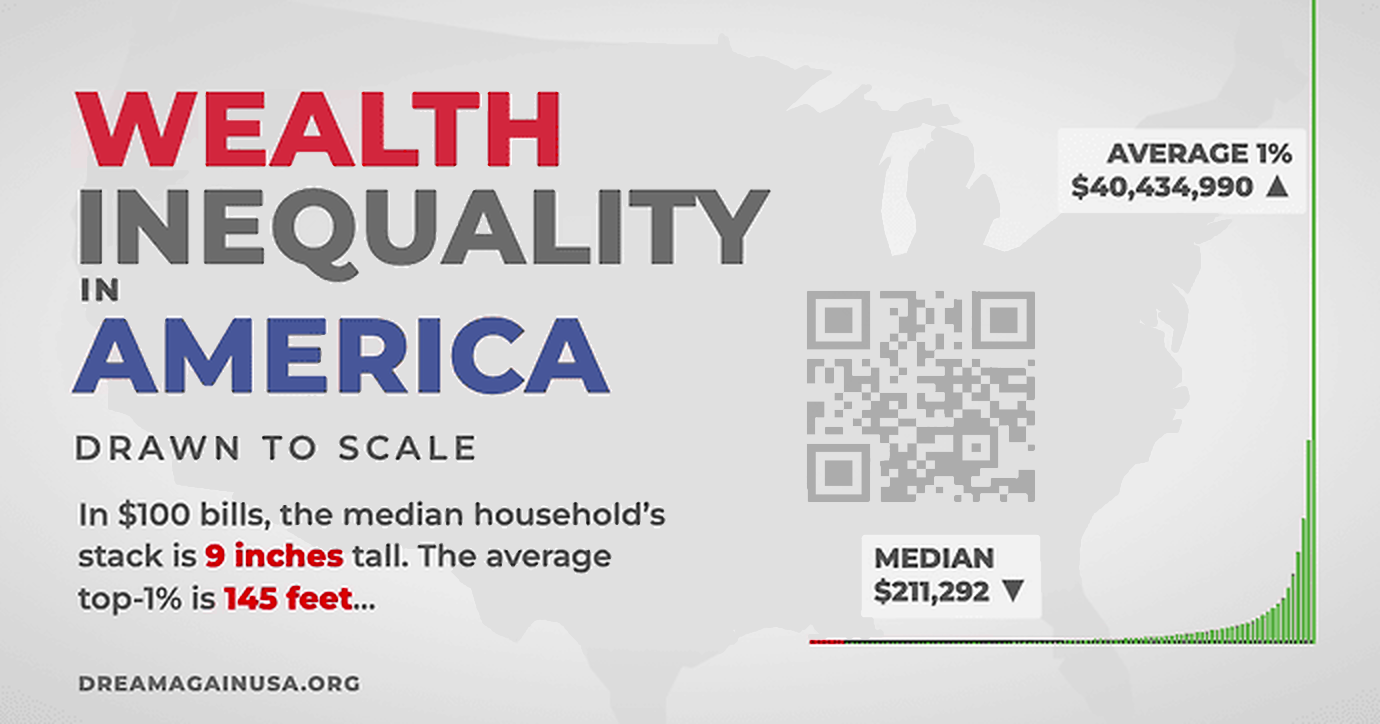
The ongoing debate surrounding economic disparity in the United States has found a novel digital expression through the launch of a new interactive web project titled Dream Again USA. Developed in collaboration by software veterans Jeff Atwood and Geoff Dalgas—best known for co-founding the developer platform Stack Overflow—the platform seeks to visualize the profound scale of American wealth concentration through an unsparing, linear-scale scrolling experience. Rather than offering rapid visual summaries or logarithmic shortcuts, the website forces users to physically scroll upward through a vast, data-driven graph that maps the economic distance between the nation’s poorest individuals and its wealthiest ultra-billionaires.
The project builds upon the intellectual framework of viral economic visualizations, most notably the widely circulated video series originally produced over a decade ago. Atwood has frequently credited that earlier media artifact with fundamentally shifting his perspective on systemic economic imbalances. By supporting the creation of an updated 2026 iteration in partnership with independent digital creators including Politizane, The Onion, and Garbage Day, Atwood aimed to reintroduce these empirical realities to a contemporary audience. Crucially, the project’s creators maintained strict editorial independence, ensuring that the resulting web tools and accompanying media serve public civic education rather than corporate or partisan interests.
Main Facts of the Digital Exhibit

At the core of Dream Again USA is a deliberate rejection of standard user experience conventions. In contemporary software design, interfaces are routinely optimized for speed, convenience, and frictionless interaction. Conversely, Atwood and Dalgas engineered this platform to incorporate deliberate friction. The website presents a linear graphical representation of American wealth distribution, requiring users to manually scroll upward through monumental economic strata.
During early development and internal testing, Atwood noted that completing a full scroll to the upper echelons of the wealth spectrum required nearly 13 minutes of continuous physical action. Throughout this ascent, users are provided with a persistent escape hatch: an "I Quit" button. This design choice serves as a stark sociological metaphor. While website visitors can effortlessly opt out of the experience and return to their comfortable routines, millions of Americans living at the base of the economic pyramid possess no such exit strategy from the systemic pressures of poverty.
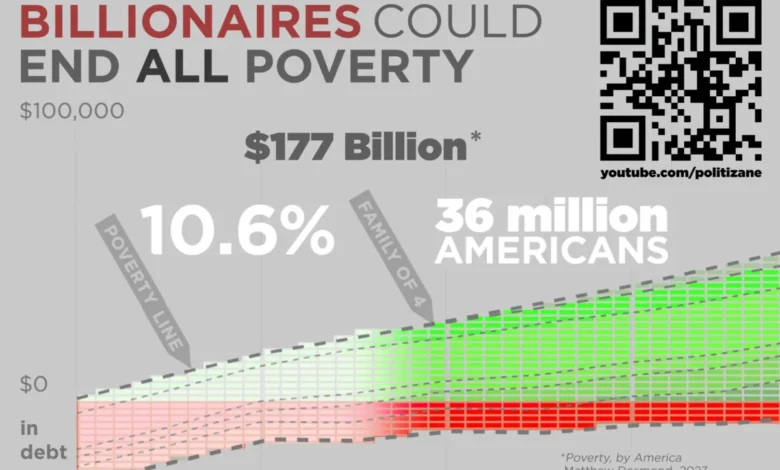
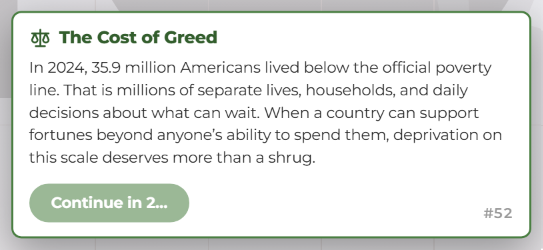
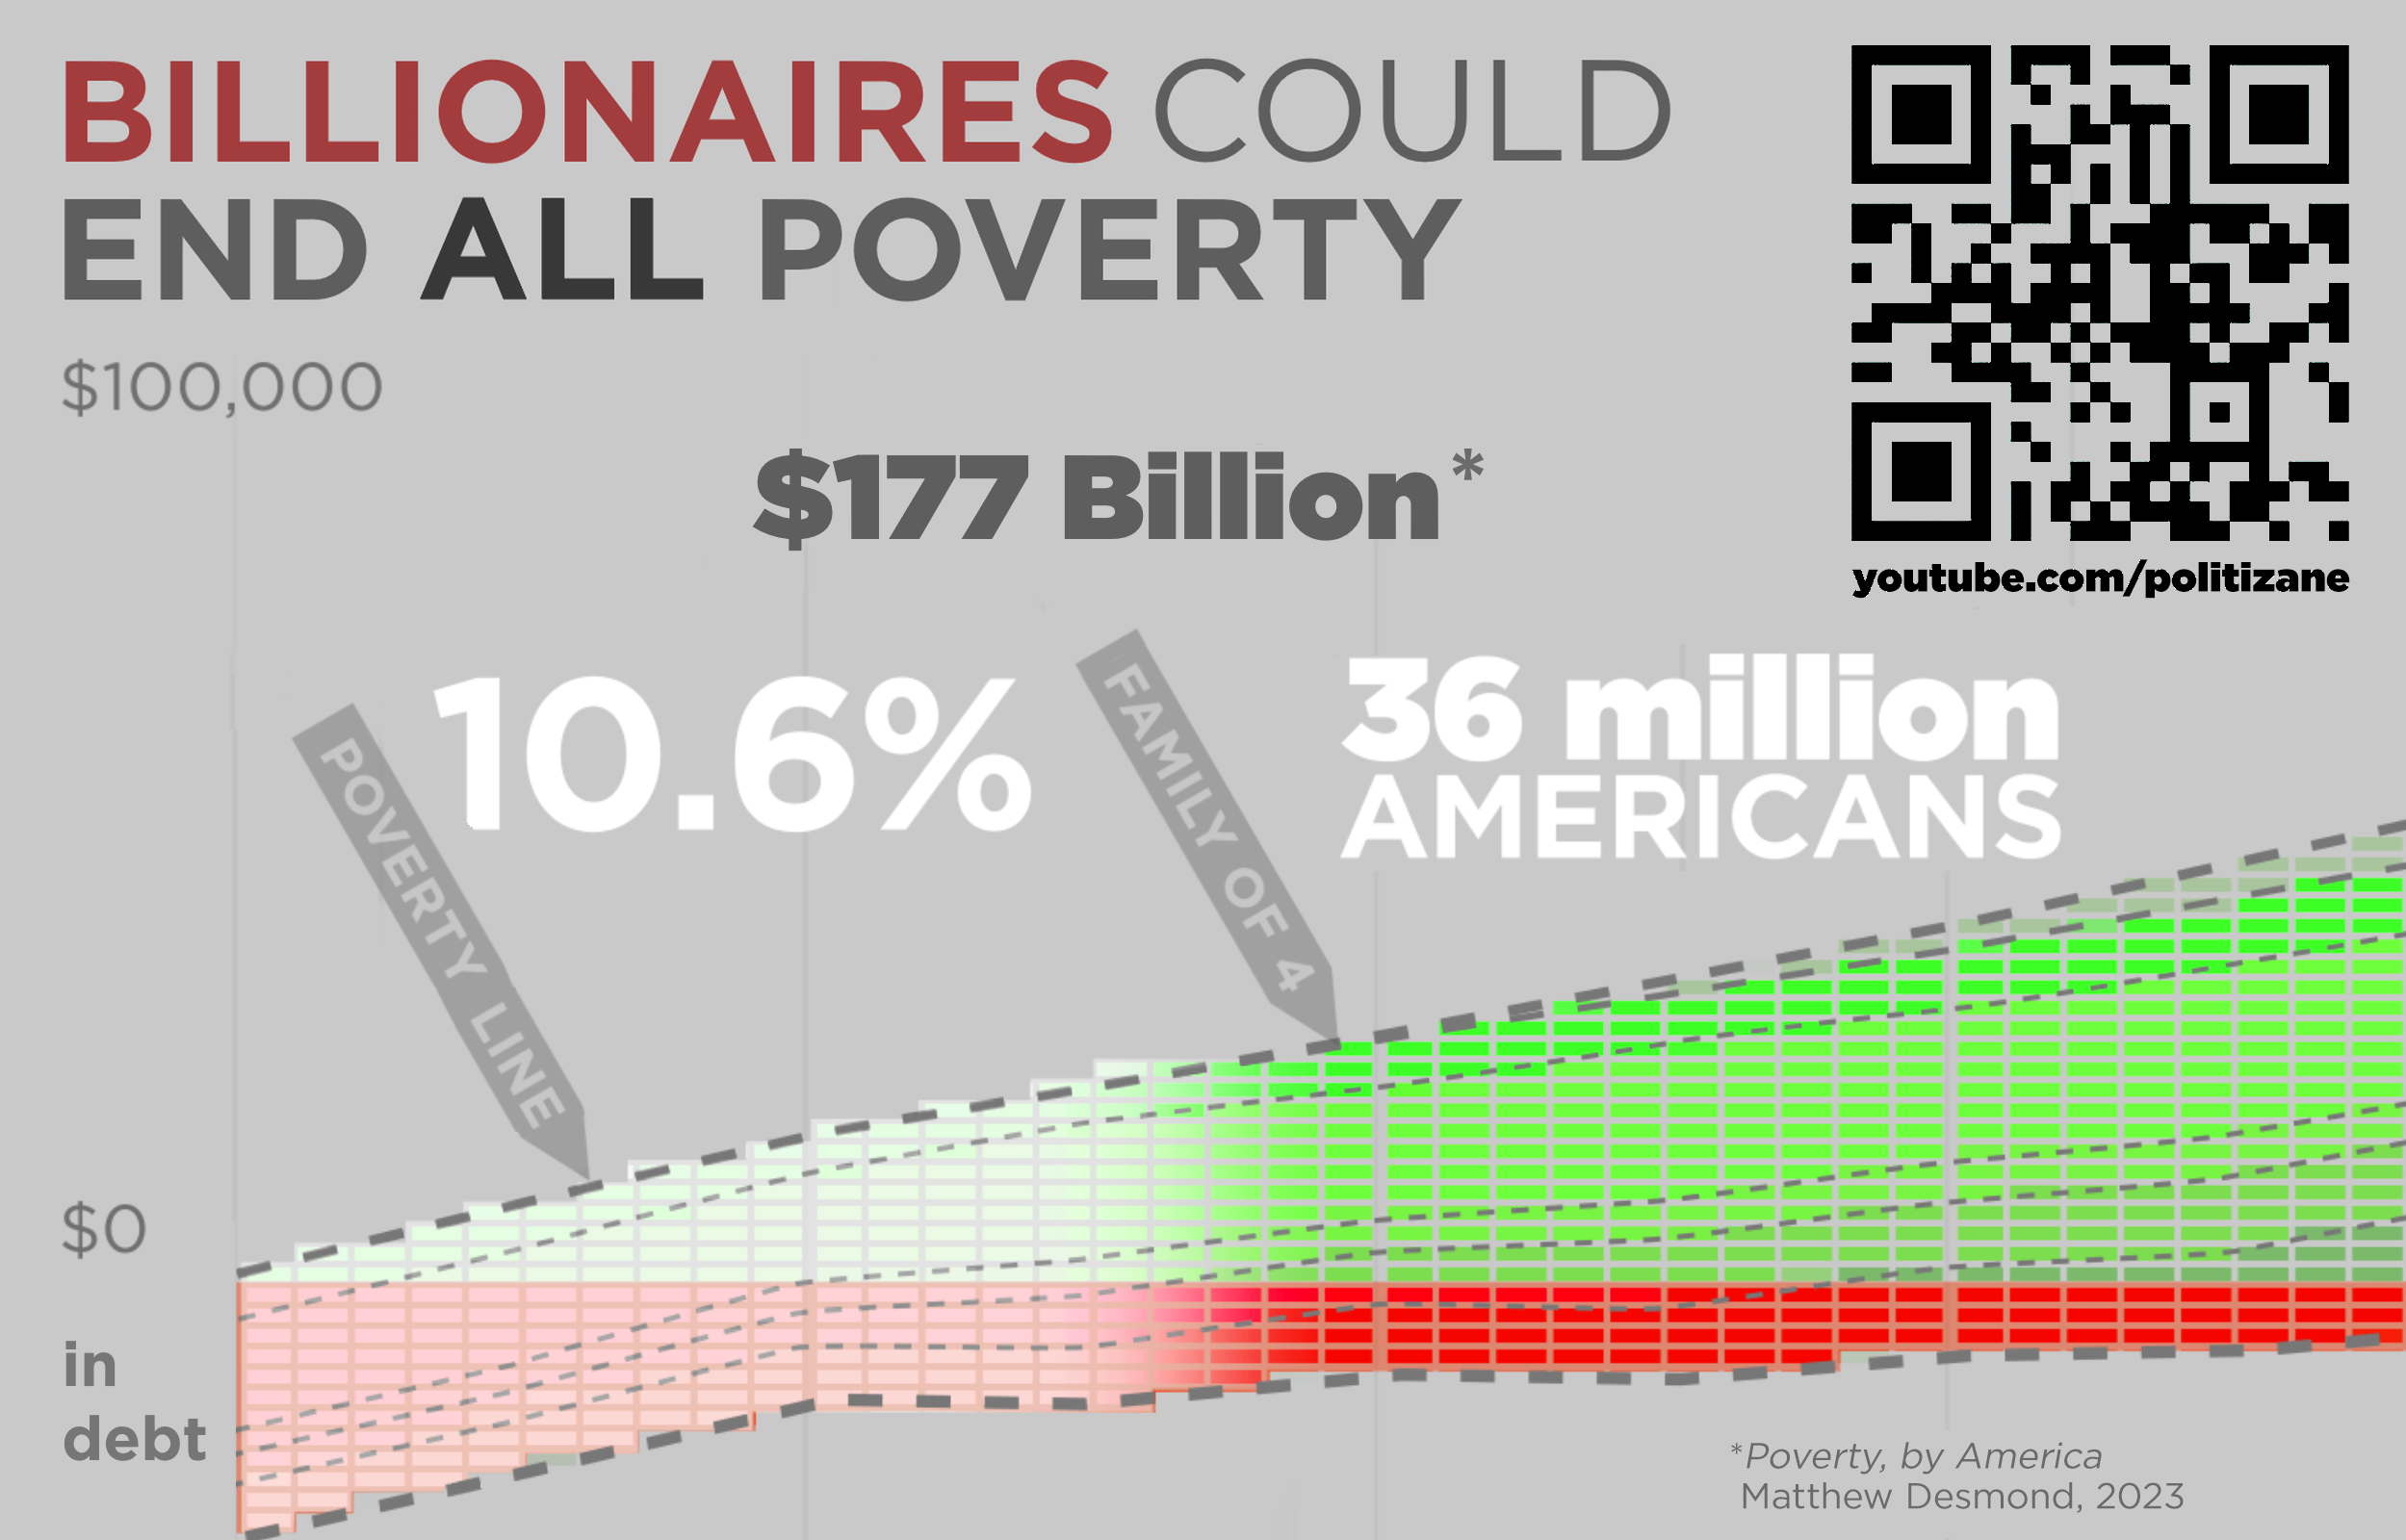
Furthermore, the platform intentionally halts the scrolling process at specific statistical milestones. For instance, the interface forces a mandatory pause when encountering the staggering metric that approximately 36 million Americans currently live in poverty. By interrupting the user’s momentum, the platform compels reflection on adjacent economic figures, such as estimates suggesting that total national poverty could theoretically be eradicated for an estimated $177 billion—a fraction of the capital accumulated by the nation’s wealthiest demographic tier.
Chronology and Background Context
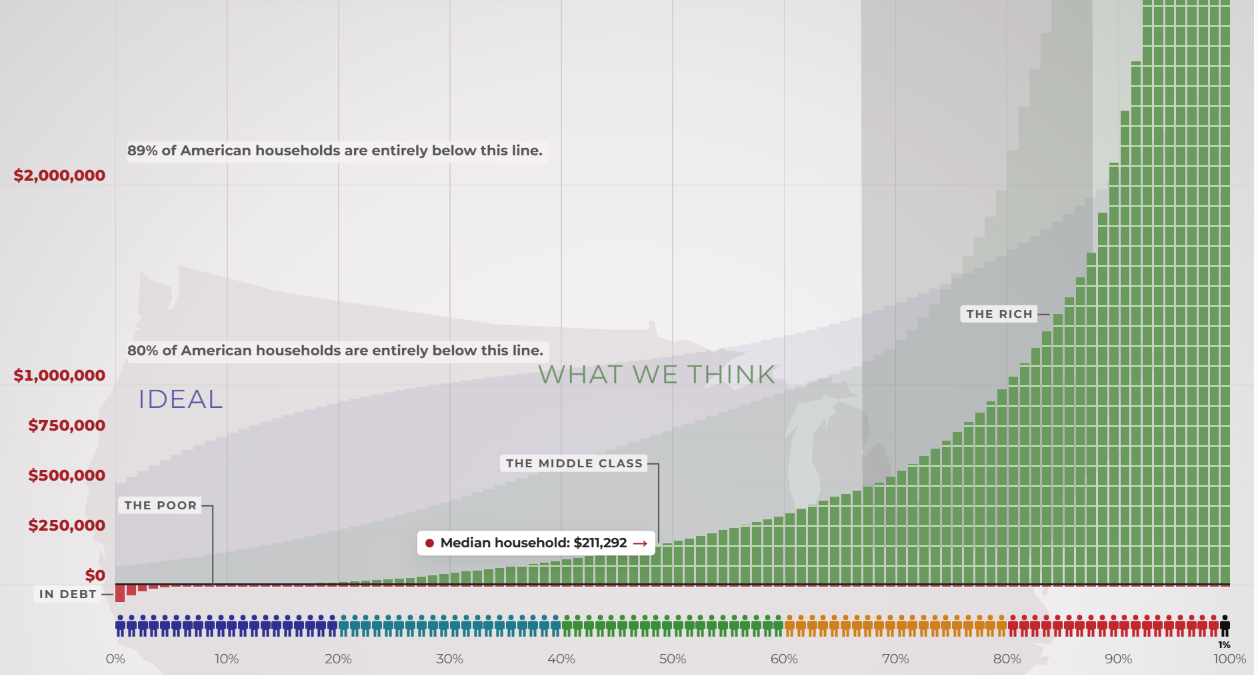
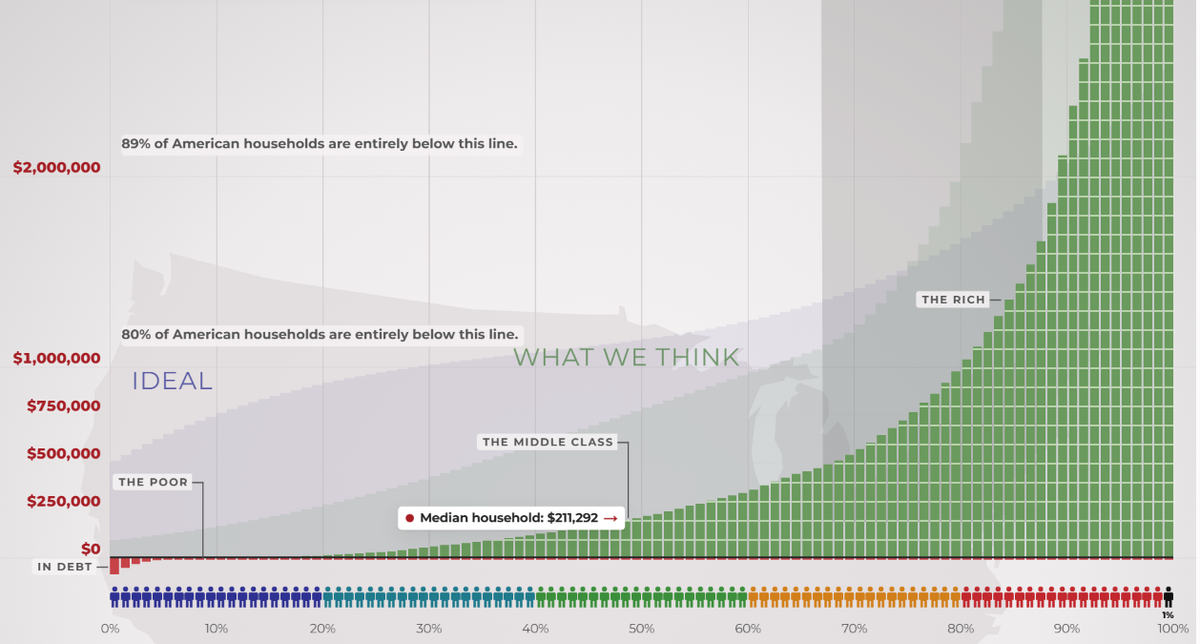
The genesis of Dream Again USA traces back to longstanding public discussions regarding income inequality, which intensified significantly in the wake of the 2008 financial crisis and subsequent economic recoveries. Over the last fourteen years, visual explainers detailing the disparity between perceived wealth distribution, ideal distribution, and actual distribution have garnered tens of millions of views across digital platforms.
Recognizing a generational shift in how younger demographics consume data and interact with web applications, Atwood envisioned an immersive tool that transcended traditional video formats. Engaging Geoff Dalgas—who has collaborated with Atwood since the foundational days of Stack Overflow in 2008—the pair spent months translating complex macroeconomic data sets into a responsive web interface. The project officially debuted in late 2026, coinciding with updated multimedia releases from independent analysts who sought to recalculate wealth concentration metrics using the most recent Federal Reserve and census data available.

Supporting Data and Methodological Framework
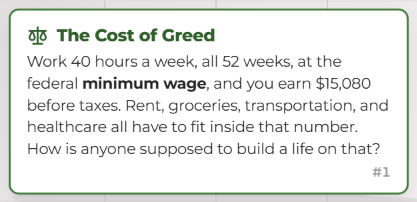
To maintain credibility within academic and journalistic circles, the underlying data driving Dream Again USA is anchored in empirical research compiled from federal agencies, economic think tanks, and wealth-tracking institutions. The platform highlights stark baseline figures, such as the federal minimum wage of $7.25 per hour, which yields an annual pre-tax income of approximately $15,080 for an individual working 40 hours a week across all 52 weeks of the year.
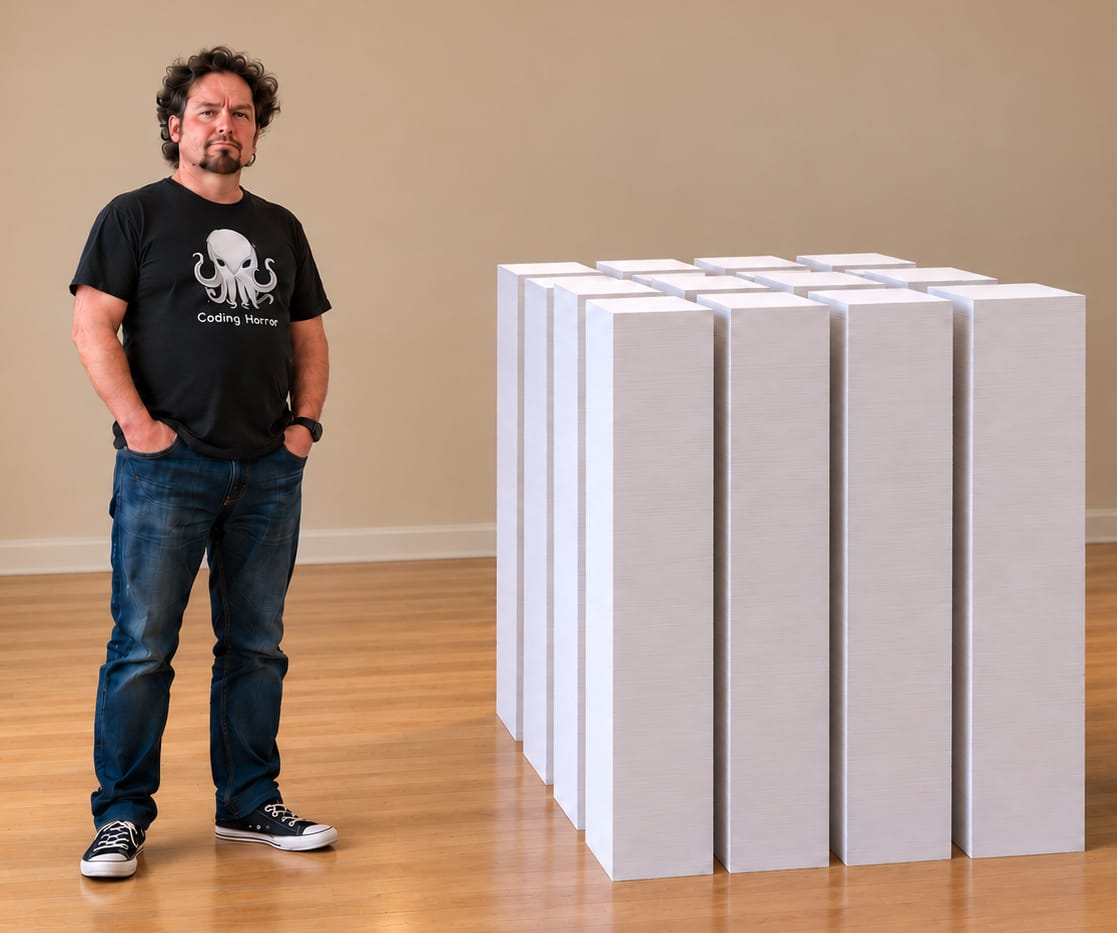
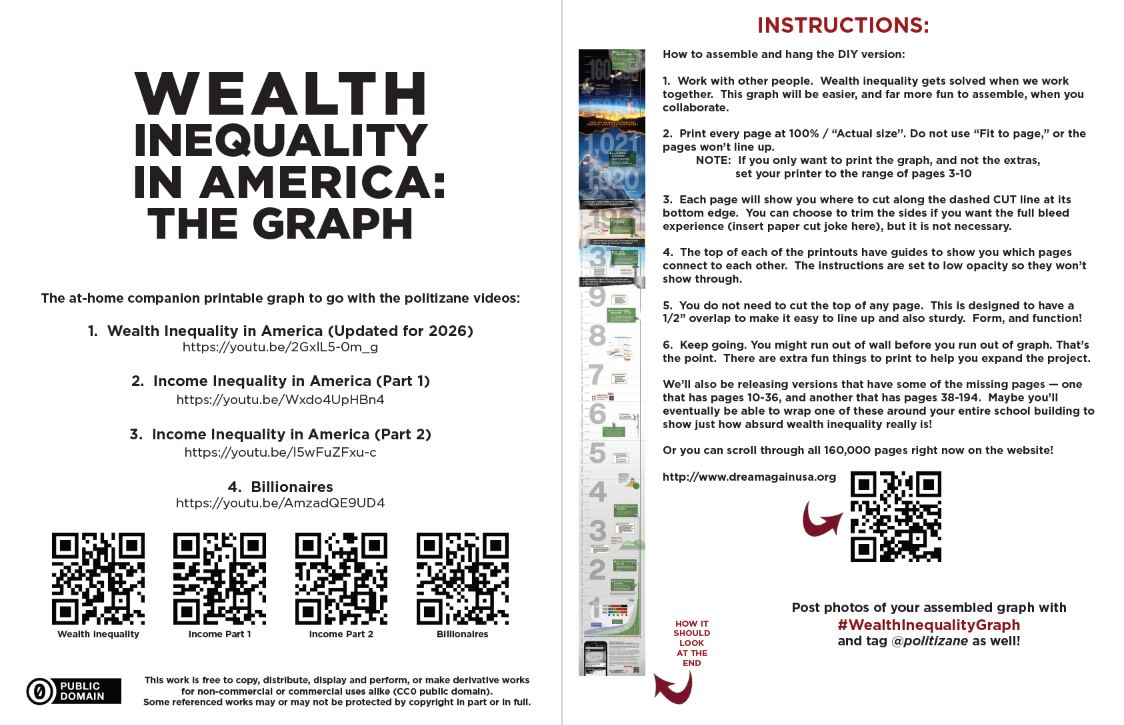
The structural challenge of illustrating this data lies in the sheer magnitude of the numerical spread. On a standard linear scale, representing the financial reality of a minimum-wage earner alongside a multi-billionaire presents severe design hurdles. Atwood noted that if printed in its entirety on standard 8.5 by 11-inch office paper, a complete linear graph of American wealth inequality would span tens of thousands of pages. To bridge this physical gap for offline engagement, the project team developed an alternative downloadable resource: an eight-page foldable graph designed to measure six feet and six inches in length—mirroring the average height of a professional basketball player—providing physical context to the abstract concept of economic stratification.
Official Responses and Industry Reception
While traditional corporate entities have largely remained silent regarding the grassroots digital project, digital rights advocates, labor economists, and software engineering communities have engaged in robust discussions concerning the platform’s unorthodox user experience design.
Critics of extreme wealth accumulation have praised the project for weaponizing user interface friction in the service of social awareness. In fields traditionally dominated by seamless optimization and conversion rate maximization, the deliberate choice to inflict cognitive fatigue—or "suffering as a feature"—has been lauded as an innovative breakthrough in data journalism and civic tech. Conversely, some economic commentators argue that linear visualizations oversimplify the dynamic nature of capital, market investments, and wealth generation, suggesting that static graphs fail to capture upward mobility or the fluidity of modern asset valuation.
Nevertheless, the project’s insistence on transparency and independent curation has largely shielded it from accusations of partisan bias. By explicitly refusing commercial monetization and disclaiming corporate sponsorship, the creators positioned the platform as a public utility for civic literacy.
Broader Impact and Economic Implications
The release of Dream Again USA arrives at a critical juncture in modern economic discourse, as policymakers grapple with persistent inflation, housing affordability crises, and widening wealth gaps. Platforms that leverage interactive technology to visualize macroeconomic data are increasingly recognized as vital tools for public education, bypassing dense academic papers in favor of visceral, experiential learning.
The broader implications of the project extend into how software developers think about ethical design. For decades, the tech industry has optimized for engagement loops designed to capture attention for commercial gain. By subverting these very patterns—forcing users to endure physical exertion and emotional discomfort to confront systemic societal issues—Atwood and Dalgas have introduced a compelling precedent for how digital interfaces can be harnessed to provoke empathy and rigorous public discourse.
As visitors continue to navigate the expansive vertical landscape of Dream Again USA, the ultimate question posed by its creators remains hanging in the digital ether: for those who successfully scale the heights of the nation’s wealth distribution, does the journey offer a meaningful reckoning with the foundational inequalities below, or does it merely reinforce the vast distance separating the apex from the base?