Advanced Geospatial Analytics: Enhancing Amazon QuickSight Layer Maps with Point and LineString Support

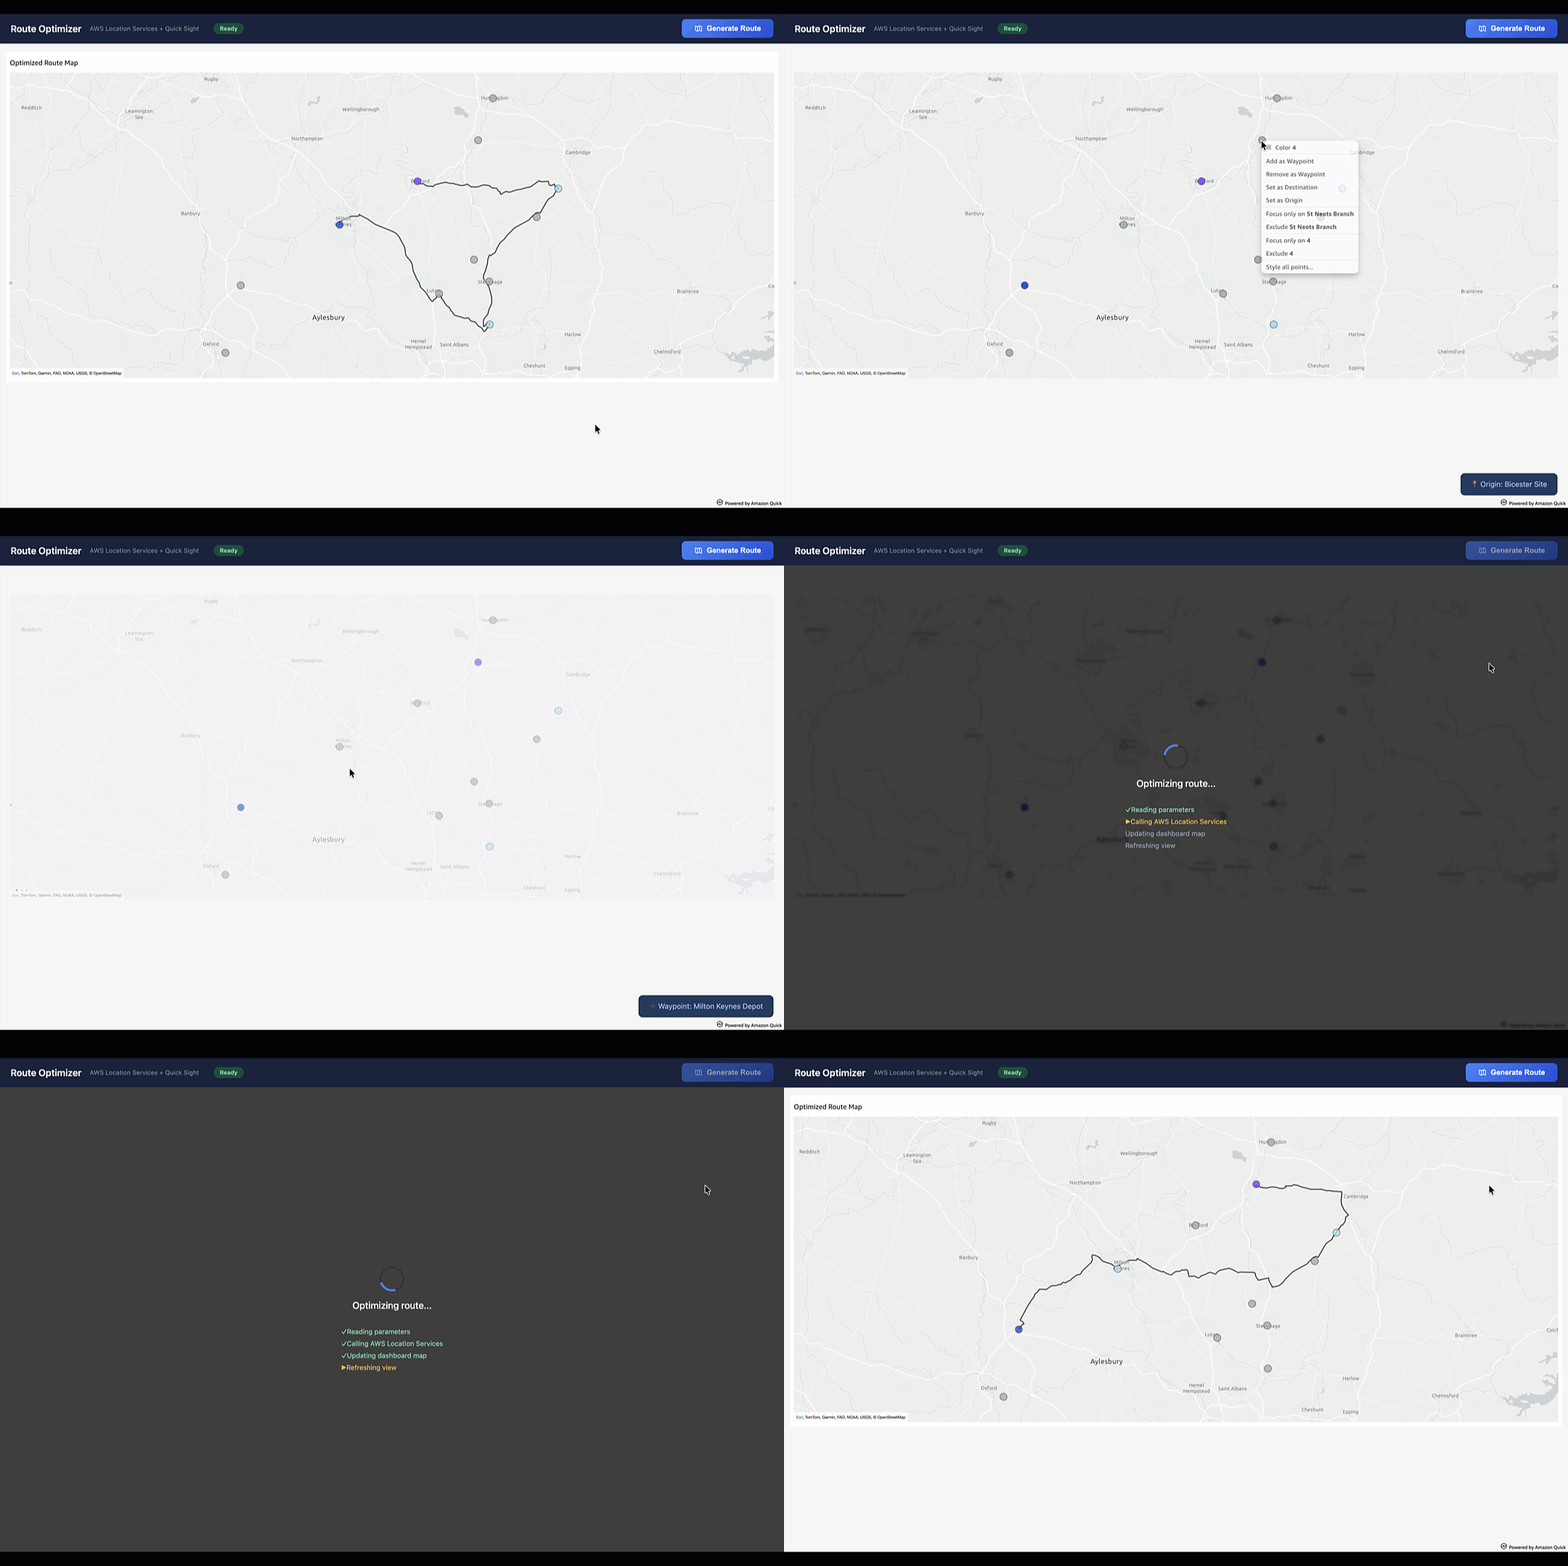
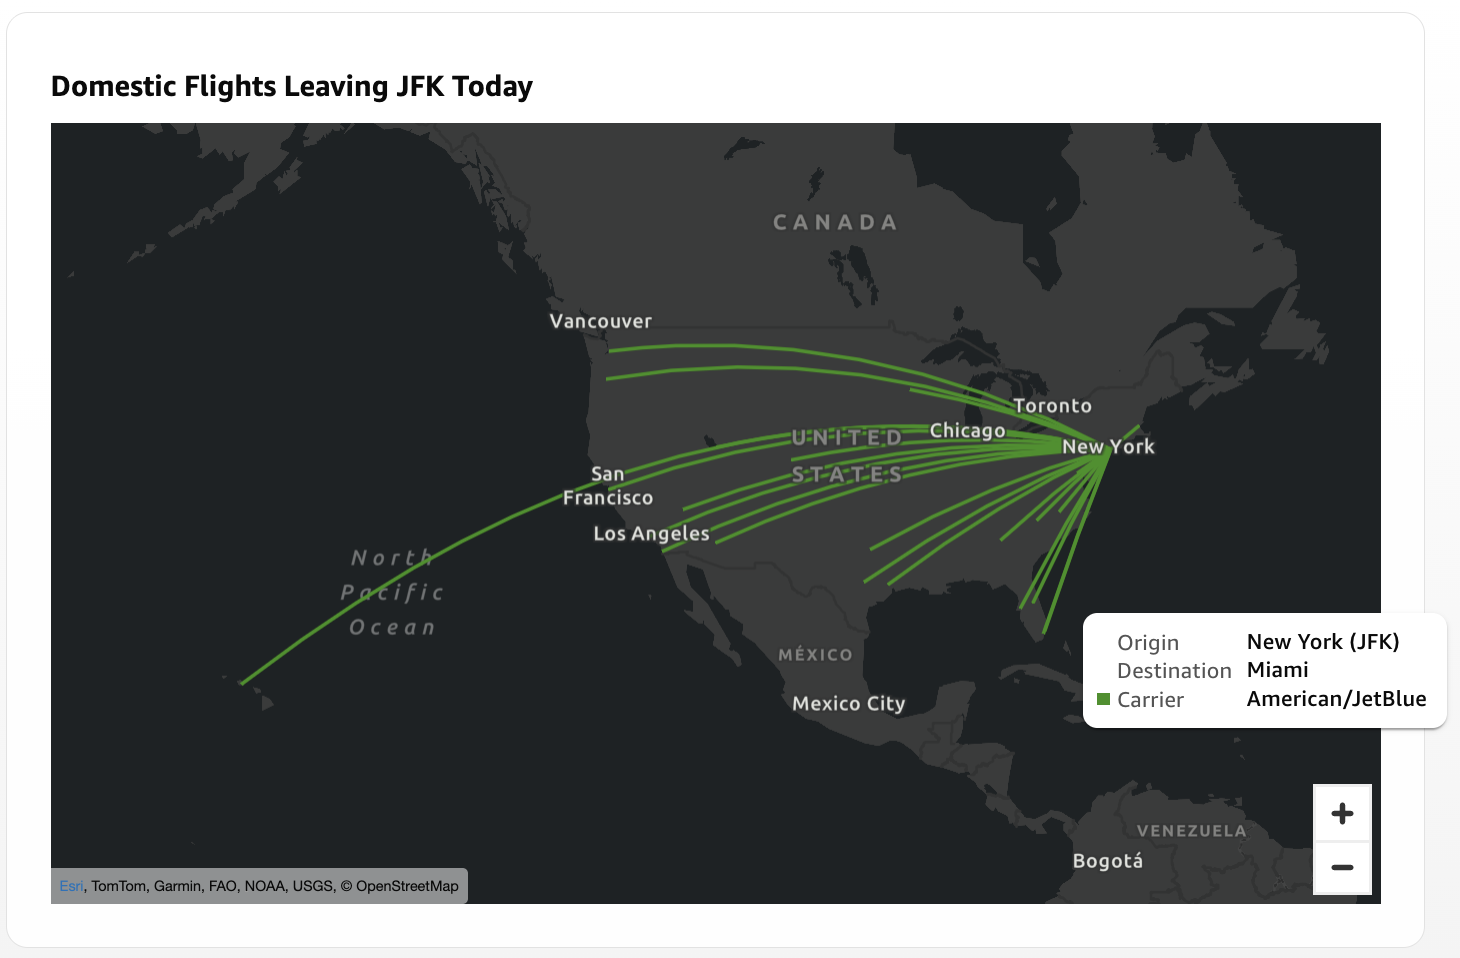
Amazon has officially expanded the capabilities of its flagship business intelligence service, Amazon QuickSight, by introducing native support for Point and LineString geometries within its layer map visualization framework. This update represents a significant evolution in how organizations can leverage geospatial data to derive actionable insights. By moving beyond simple regional boundary plotting, businesses can now visualize intricate logistical paths, such as flight trajectories, supply chain delivery routes, and specific infrastructure site locations, directly within their interactive BI dashboards. This advancement bridges the gap between static regional reporting and dynamic, location-specific operational monitoring.
Evolution of Geospatial Capabilities in Business Intelligence
The introduction of GeoJSON-based layer maps in previous iterations of Amazon QuickSight allowed users to visualize complex territories, such as sales districts, zip code boundaries, or municipal administrative regions. While these polygon-based maps were essential for regional performance analysis, they lacked the granularity required for micro-level operations. Data analysts often found themselves constrained when attempting to map individual assets or the connective paths between them.
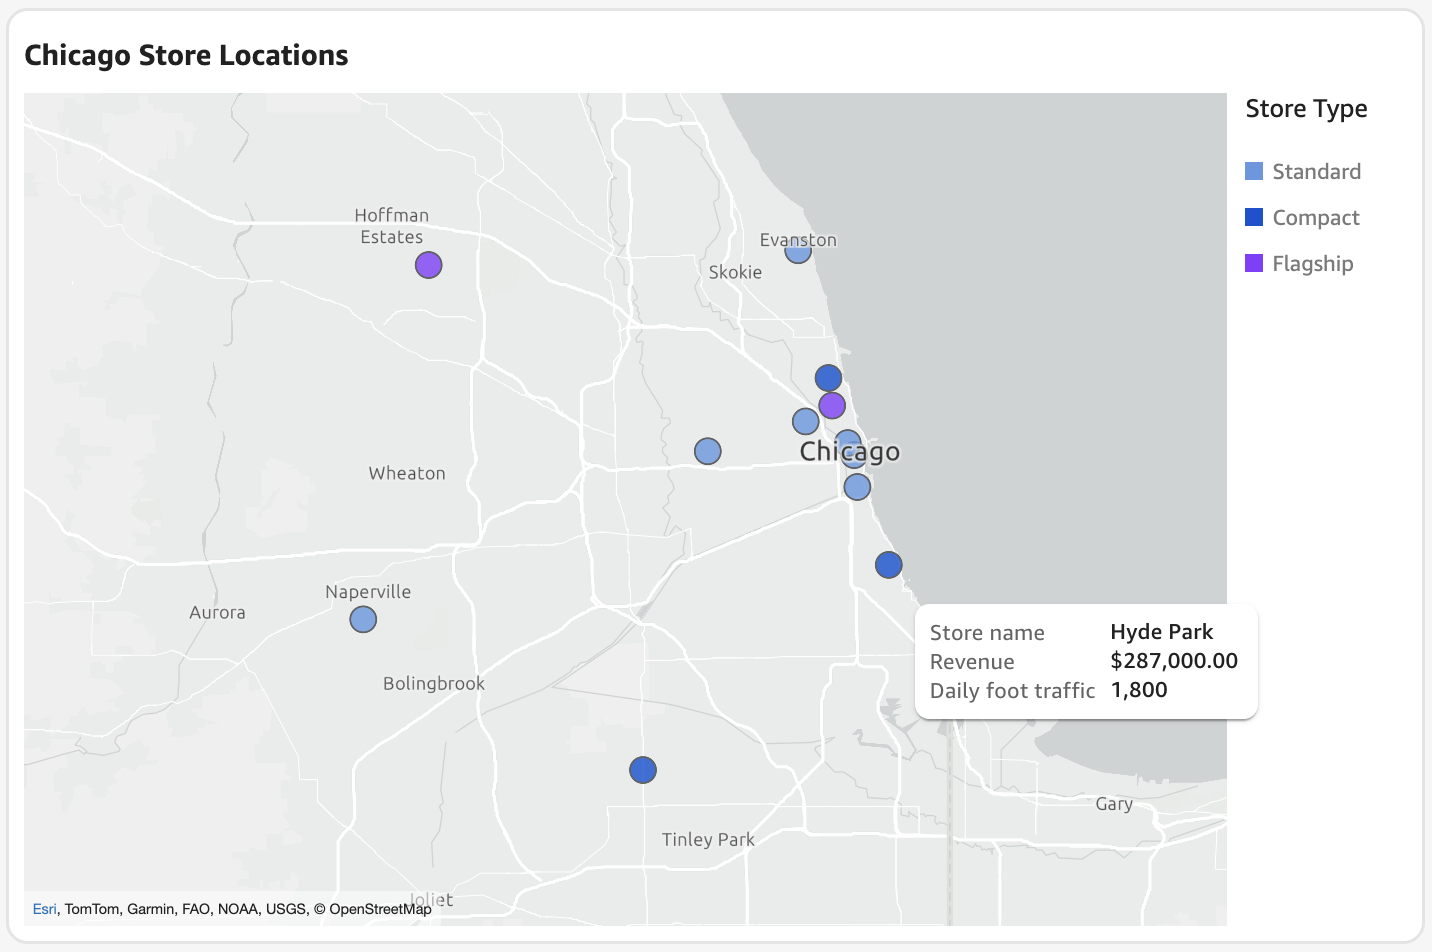
With the current integration of Point and LineString support, QuickSight users can now achieve a higher degree of spatial precision. A Point feature serves to denote a specific, fixed geographic coordinate—ideal for tracking individual retail storefronts, warehouse facilities, or communication towers. Conversely, a LineString feature connects an ordered sequence of coordinates, enabling the visualization of paths, shipping lanes, or telecommunications cabling. This transition reflects a broader industry shift toward "location intelligence," where the spatial relationship between disparate data points becomes just as critical as the numerical metrics associated with them.

Technical Implementation and Dataset Architecture
The functionality relies on a robust join mechanism between two distinct data sources: a standard QuickSight dataset—which houses the core business metrics—and a GeoJSON file, which defines the geographic geometry. The efficacy of these maps depends on a "shared key" architecture. For instance, an organization tracking a logistics network would utilize a unique identifier, such as a "Route ID" or "Store ID," present in both the database and the GeoJSON file to merge the two datasets seamlessly.
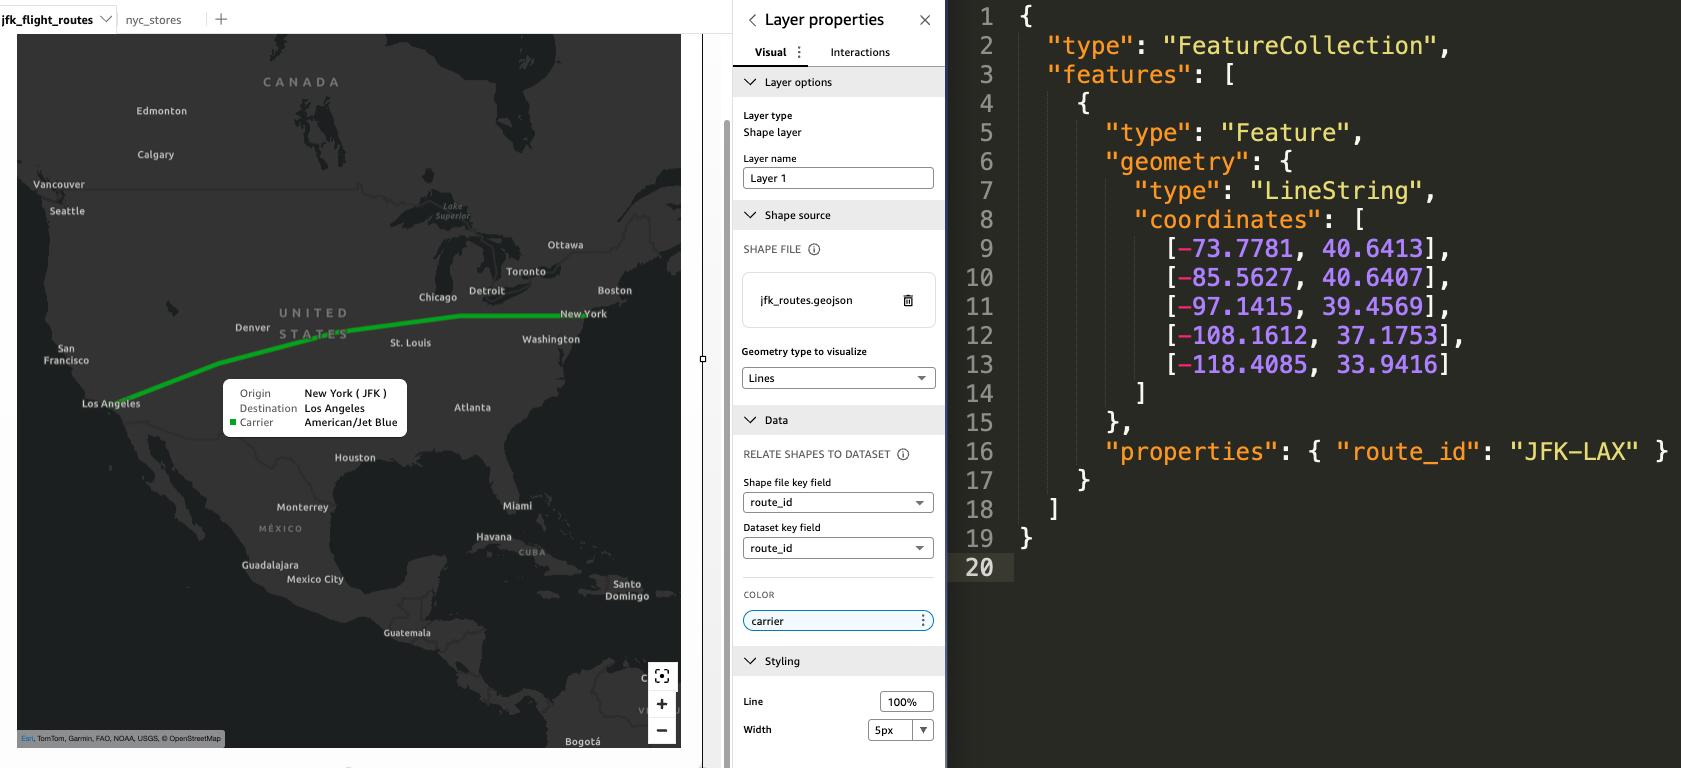
In the case of LineString implementation, the GeoJSON file acts as a geometric roadmap. When configuring a flight path, the GeoJSON contains an ordered list of coordinate pairs representing the trajectory from origin to destination. By joining this with a dataset containing flight metadata—such as carrier information, flight duration, or fuel consumption—analysts can create a visualization that is both geographically accurate and analytically rich.
Strategic Implications for Data-Driven Operations
The ability to map LineStrings offers transformative potential for supply chain and logistics management. Historically, companies relied on separate, specialized GIS software to plot delivery routes or analyze shipping bottlenecks. By integrating these capabilities into a unified BI service, Amazon is streamlining the analytics workflow. Stakeholders can now view real-time performance indicators alongside visual representations of their physical distribution networks.
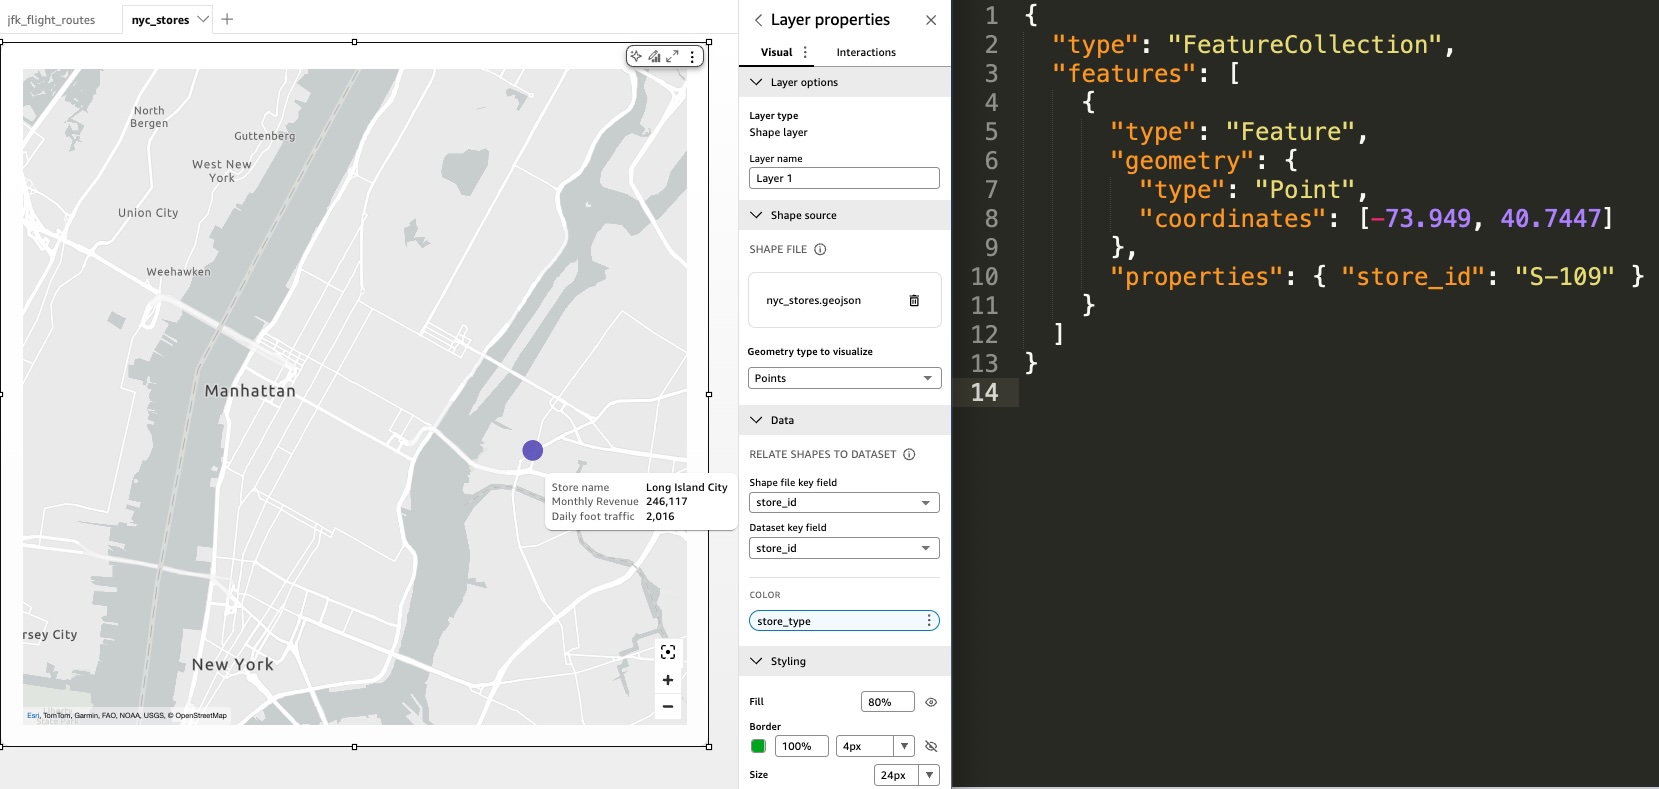
For retail enterprises, the addition of Point layers provides a nuanced view of store performance within specific urban centers. Unlike traditional point maps, which often rely on automatic geocoding—a process that can be prone to inaccuracies depending on the quality of address data—the new layer map points allow for the use of precise, user-defined coordinates. This ensures that assets are rendered exactly where they are situated on the ground, a vital requirement for high-stakes operational environments.

Comparative Analysis: Point Maps vs. Layer Map Points
To ensure optimal performance, users must distinguish between the native "Point Map" visual and the new "Layer Map Point" functionality. The native Point Map is designed for data that is subject to frequent updates and requires geocoding. It is inherently dynamic, refreshing in tandem with SPICE (Super-fast, Parallel, In-memory Calculation Engine) datasets.
In contrast, the Layer Map visual for points is intended for more static, high-precision requirements. Because it does not rely on automatic geocoding, it eliminates the risk of misplacement due to ambiguous address strings. Furthermore, it offers superior control over the viewport. Users can explicitly lock the map’s zoom level and geographic extent, preventing dashboard viewers from inadvertently navigating away from a designated region—a common pain point in interactive reporting.
Advanced Visualization Techniques and Best Practices
For power users, the platform supports advanced composition through the layering of multiple visuals. By stacking separate layer maps in a free-form layout, an analyst can create a multi-dimensional view. A common application involves layering Point features, such as specific delivery stops, atop a LineString layer representing the planned delivery route. This composition allows for an immediate visual audit of how closely actual operations align with planned strategies.
Furthermore, the integration with Amazon S3 and the QuickSight API allows for dynamic updates. In scenarios where route planning is automated—such as an on-demand fleet management system—the underlying GeoJSON file can be programmatically updated and re-rendered. This capability enables the development of highly specialized, embedded analytics applications where the map is not just a reporting tool, but an active component of the operational decision-making loop.
Institutional Context and Future Outlook
The release of these features aligns with the broader AWS strategy of providing "unified business intelligence." By consolidating AI-driven insights, natural language querying, and high-fidelity geospatial mapping into a single ecosystem, Amazon is positioning QuickSight as a comprehensive solution for enterprise-level data consumption. The focus on security and access policies remains a hallmark of this rollout; as these maps often contain sensitive operational data, the integration ensures that geospatial insights are subject to the same granular permission controls as tabular data.
Industry analysts observe that the move toward more flexible, user-defined geometry is a response to the growing demand for "operationalized" BI. As businesses move away from retrospective reporting and toward real-time monitoring, the capacity to visualize movement and location becomes a critical competitive advantage.
Conclusion and Practical Implementation
The integration of Point and LineString geometries into Amazon QuickSight’s layer maps marks a pivotal step toward more sophisticated, location-aware data analysis. By adhering to the established GeoJSON formatting and utilizing the platform’s API for programmatic updates, organizations can effectively transform their dashboards into dynamic command centers.
For teams currently evaluating their BI architecture, the recommendation is to assess whether their use cases require the fluidity of automatic geocoding or the rigid precision of fixed-coordinate mapping. Those prioritizing operational control and complex path visualization will find the new layer map capabilities to be a robust addition to their analytical toolkit. As organizations continue to digitize their physical footprints, the ability to bridge the gap between abstract business metrics and concrete geographic reality will undoubtedly remain a cornerstone of effective data strategy in the coming years.