Unveiling the 2018 Private SaaS Company Survey Results: Insights into Growth, Sales Efficiency, and Capital Utilization


For the seventh consecutive year, industry researchers have released the highly anticipated annual benchmark report on private Software-as-a-Service (SaaS) companies, developed in close collaboration with the KBCM Technology Group—formerly recognized in the financial sector as Pacific Crest Securities—and the digital publication forEntrepreneurs. This year’s comprehensive report draws upon detailed financial and operational data submitted by approximately 385 private SaaS enterprises globally, offering an unprecedented look into the inner workings, growth trajectories, and operational efficiencies of the modern cloud software industry.

The release of this exhaustive data trove provides founders, venture capitalists, institutional investors, and enterprise executives with critical baseline metrics required to navigate an increasingly competitive technology marketplace. By analyzing everything from annual recurring revenue (ARR) growth and human capital efficiency to customer acquisition cost (CAC) ratios and go-to-market strategies, the 2018 benchmark study serves as an essential compass for scaling digital enterprises.
Methodological Shifts and Data Precision
A notable evolution in this year’s survey methodology was the transition from broad data ranges to precise numerical reporting. In previous iterations, participating companies provided estimated ranges for critical metrics such as Annual Recurring Revenue, customer churn rates, and the precise attribution of sales and marketing expenditures. For the 2018 report, organizers requested exact figures, allowing analysts to calculate 2017 metrics with a heightened degree of mathematical accuracy.
This methodological refinement has enabled a more rigorous examination of unit economics across various corporate maturities. With roughly 385 organizations participating, the dataset captures a remarkably diverse cross-section of the private SaaS ecosystem. The respondents represent a wide spectrum of scale, ranging from early-stage startups generating under $5 million in ARR to mature enterprise organizations operating well past the $50 million revenue threshold. Geographically, the overwhelming majority of participants are anchored in North America, reflecting the dominant hub of venture-backed SaaS innovation, though international participation continues to provide a valuable global perspective.
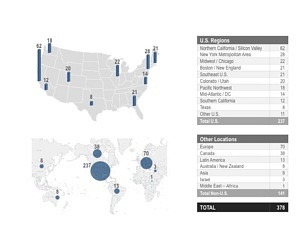
Demographic Composition and Human Capital Efficiency
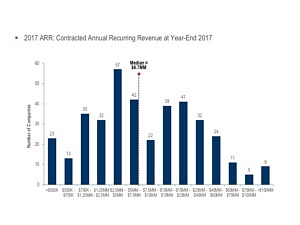
Understanding who participated in the survey is vital to contextualizing the broader industry trends highlighted in the report. The participant distribution shows a heavy concentration in the sub-$5 million ARR tier, which accounted for 160 respondents. Mid-tier companies scaling between $5 million and $10 million represented 65 participants, while those positioned in the $10 million to $25 million bracket contributed 80 responses. Further up the scale, 47 companies reported ARR between $25 million and $50 million, and 33 enterprise-grade respondents exceeded the $50 million ARR mark.
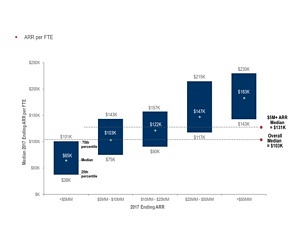
When evaluating human capital efficiency—measured by ARR per Full-Time Employee (FTE)—the data illustrates how organizational productivity scales alongside revenue generation. As SaaS companies grow, they typically encounter structural inflection points where headcount must expand to support broader product lines, expanded customer success operations, and larger sales organizations. The survey metrics reveal distinct plateaus in employee efficiency, illustrating the delicate balance between aggressive hiring to capture market share and maintaining lean, capital-efficient operations. Industry analysts note that optimizing human capital efficiency remains one of the primary challenges for executives attempting to bridge the gap between mid-market status and enterprise dominance.
Organic ARR Growth Dynamics
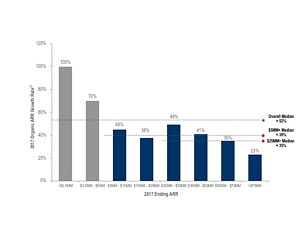
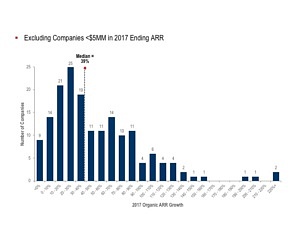
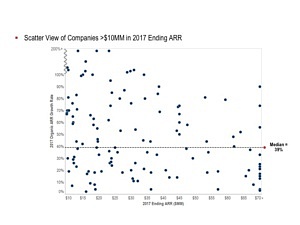
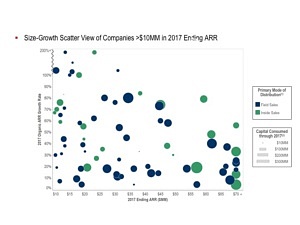
Growth remains the definitive currency of the SaaS industry, yet the 2018 survey underscores a humbling reality for hyper-growth hopefuls: rapid expansion becomes progressively harder to sustain as a company scales. Analyzing the organic ARR growth rates of 261 respondents—excluding inorganic growth driven by mergers and acquisitions—reveals a clear inverse relationship between company size and percentage growth velocity.
The data shows a long, sparse "tail" of outlier companies achieving hyper-growth well above the median, but such astronomical expansion is exceptionally rare at scale. For companies starting at lower revenue bases, median organic growth rates frequently exceed 50% to 100% annually. However, as firms cross the $25 million and $50 million ARR thresholds, growth naturally compresses toward a mature median.
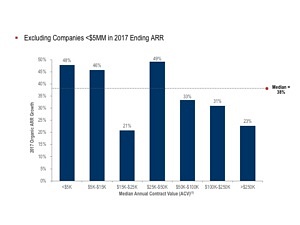
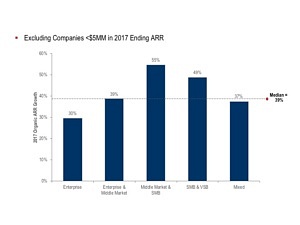
Furthermore, the survey investigated median growth rates as a function of annual contract value (ACV) and target customer profiles. Enterprises targeting traditional large-scale corporations—defined as organizations with more than 1,000 employees—frequently experience different growth dynamics compared to those pursuing Small and Medium Businesses (SMBs) or Very Small Businesses (VSBs). Companies categorized by target market focus (where at least two-thirds of revenue originates from a specific customer segment) demonstrate that deal size profoundly influences sales cycles, product complexity, and expansion potential.
The Vital Role of Upsells and Expansions
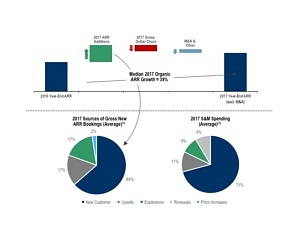
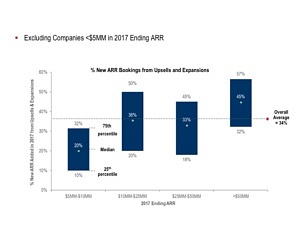
Acquiring a new logo is only the first chapter in the lifecycle of a SaaS customer. The 2018 report places significant emphasis on the reliance organizations place on upsells, cross-sells, and account expansions to drive continuous revenue growth. For respondents generating between $5 million and over $50 million in ARR, net revenue retention and expansion ARR serve as primary engines for compounding growth.
In many high-performing SaaS businesses, expansion revenue from existing clients significantly mitigates the natural friction of customer churn. Companies that successfully implement land-and-expand strategies find themselves less dependent on top-of-funnel acquisition to hit aggressive annual targets. The survey data highlights that top-quartile performers derive a substantial percentage of their new ARR from existing accounts through seat expansion, feature tier upgrades, and the introduction of complementary product modules.
Go-To-Market Strategies: Field Sales vs. Inside Sales
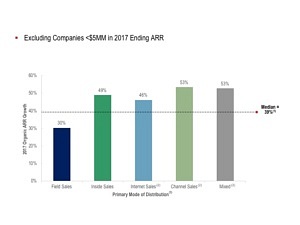
One of the most exhaustive sections of the 2018 benchmark report focuses on go-to-market (GTM) methodologies, sales strategies, and distribution channels. The primary mode of distribution—defined as the channel responsible for the greatest contributor to new sales, outperforming alternative channels by at least 30 percentage points—dramatically impacts both growth rates and capital consumption.
The report breaks down distribution into field sales, inside sales, internet/self-serve sales, channel sales, and mixed strategies. Field sales dominated among respondents with higher median ARR figures (averaging around $18 million), typically aligning with larger initial contract sizes exceeding $100,000. Conversely, inside sales models supported robust median ARR figures (around $19 million), proving highly effective for mid-market deal tiers. Internet-driven sales, while representing a smaller sample size among respondents, captured some of the highest median ARR efficiency metrics for companies leveraging frictionless, product-led growth motions.
A critical area of analysis within the report examines the crossover deal size tiers where field sales and inside sales compete. By evaluating gross margin-adjusted metrics, churn, and fully loaded sales and marketing costs, the data provides a pragmatic roadmap for executive leadership teams deciding when to transition from a transactional inside sales model to a high-touch field sales organization.
Sales and Marketing Spend and Capital Efficiency
Investing in growth requires capital, and the correlation between sales and marketing (S&M) expenditures and growth rates is a central theme of the KBCM Technology Group findings. Among the 159 respondents who detailed their S&M allocations, spending as a percentage of revenue varied wildly—from under 20% to well over 100% for hyper-growth startups heavily subsidized by venture capital.
The survey dissects the internal composition of S&M costs, separating direct sales compensation from marketing overhead. The findings suggest that companies utilizing field-dominant strategies allocate a significantly different proportion of capital toward direct sales headcount and travel expenses compared to inside or internet sales models, which lean more heavily on digital marketing acquisition funnels and scalable inbound lead generation.
Customer Acquisition Cost (CAC) Ratios and Payback Periods

Unit economics ultimately dictate the long-term viability of any software business. The 2018 report offers a granular look at Customer Acquisition Cost (CAC) ratios, contrasting self-reported data with rigorously calculated metrics based on precise 2017 financial inputs.
By dividing fully loaded sales and marketing expenses by new ARR components, the survey calculates the true cost required to acquire new customers versus expanding existing ones. Furthermore, the report establishes implied CAC payback periods on a gross margin basis—defining the exact number of months of subscription gross profit required to recover the fully loaded cost of customer acquisition.
Across nearly 140 reporting companies, the median CAC payback period provides a vital benchmark for operational health. Investors and financial analysts generally view a CAC payback of under 12 months as highly efficient, while payback periods stretching beyond 18 to 24 months require substantial lifetime value (LTV) advantages to justify the upfront capital burn.
Broader Industry Implications and Outlook
The publication of the 2018 SaaS survey results arrives at a transformative juncture for the technology sector. As private capital markets experience robust liquidity and investor scrutiny intensifies around sustainable unit economics, data-driven operational management has never been more critical for executive leadership.
The findings from the collaborative effort between forEntrepreneurs and KBCM Technology Group underscore a maturing industry. The era of growth-at-all-costs is increasingly being tempered by a rigorous focus on capital efficiency, net revenue retention, and optimized go-to-market alignment. By establishing transparent benchmarks across deal sizes, distribution channels, and acquisition costs, the report equips SaaS leaders with the empirical evidence needed to benchmark their performance, refine their operational strategies, and secure the next generation of institutional investment. As private companies continue to scale in an increasingly competitive global economy, the insights captured within this landmark 2018 study will undoubtedly remain a cornerstone of strategic enterprise planning for years to come.