Five Free Excel Dashboard Templates Every Project Manager Needs for Efficient Tracking

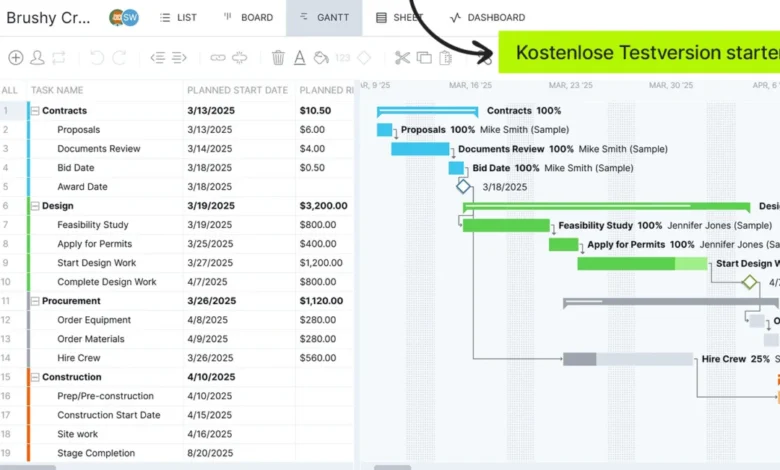
Project management requires precision, foresight, and the ability to process vast amounts of operational data in real time. For decades, project managers have relied on visual dashboards to track Key Performance Indicators (KPIs), monitor resource allocation, and ensure that deliverables align with established budgets and timelines. While modern software solutions offer automated, cloud-based tracking, Microsoft Excel remains an indispensable foundational tool for organizations transitioning away from purely manual documentation. To bridge this gap, industry analysts and workflow optimization platforms have released a comprehensive suite of five free Excel dashboard templates tailored to specific organizational needs. These templates—spanning general project tracking, KPI analysis, budget control, task management, and asset tracking—provide teams with structured frameworks to maintain operational transparency without committing immediate capital to enterprise software licenses.

The Evolution of Project Tracking and the Role of Excel
The historical reliance on spreadsheet software in corporate environments stems from its universal accessibility and flexibility. Before dedicated project management software dominated the market, teams constructed bespoke formulas and conditional formatting rules to visualize project health. However, building an effective dashboard from scratch demands advanced technical proficiency, often leading to formatting errors or inconsistent data reporting.

The introduction of pre-built, standardized templates addresses this friction point. By offering structured layouts equipped with integrated charts and automated visual cues, organizations can standardize how project data is recorded and reviewed. Industry observers note that while static spreadsheets require manual data entry—introducing potential human error—they remain vital stepping stones for small-to-medium enterprises, freelance consultants, and internal departments operating under strict budgetary constraints.
Detailed Breakdown of the Five Free Templates
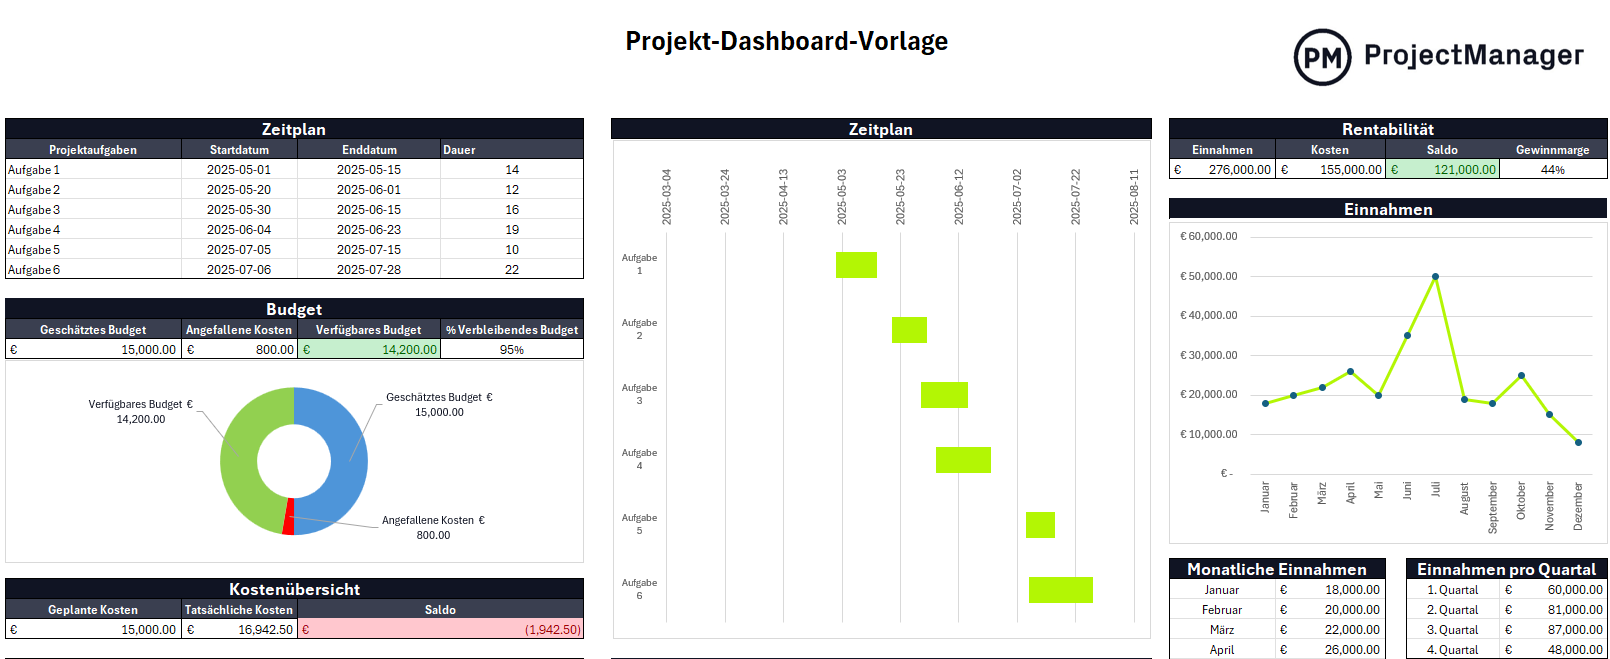
The newly released collection focuses on distinct pillars of operational management, ensuring that users can select a framework matching their immediate project scope.
-
The Comprehensive Project Dashboard Template
Designed to offer a holistic overview of a project lifecycle, this template utilizes multiple bar and pie charts to measure ongoing progress against the baseline project plan. A primary pie chart categorizes tasks into completed, in-progress, overdue, and unstarted statuses, giving supervisors an immediate performance snapshot. Additionally, a color-coded workload bar chart highlights resource distribution, while duration and cost diagrams allow managers to compare actual expenditures against projected financial models for specific periods.
-
The KPI Dashboard Template for Strategic Oversight
For organizations seeking macro-level insights, the KPI dashboard expands beyond single projects to evaluate broader institutional performance. This template integrates annual profit-and-loss overviews featuring dual-axis income and expense tracking. Data is systematically segmented into monthly and quarterly revenue models, alongside specialized graphs dedicated to workforce utilization and resource capacity planning. This multi-layered approach helps executive leadership quickly identify whether corporate operations are running at a net gain or deficit. -
The Budget Dashboard Template for Financial Control
Cost overruns represent one of the most frequent causes of project failure. The budget dashboard template provides a granular breakdown of fiscal data, incorporating dedicated fields for purchase order numbers, client identities, task descriptions, and milestone dates. Color-coded donut charts compare planned versus actual expenditures across direct material costs, labor expenses, equipment rentals, and overheads. By visualizing these metrics continuously, financial controllers can intercept budget variances before they jeopardize overall project viability.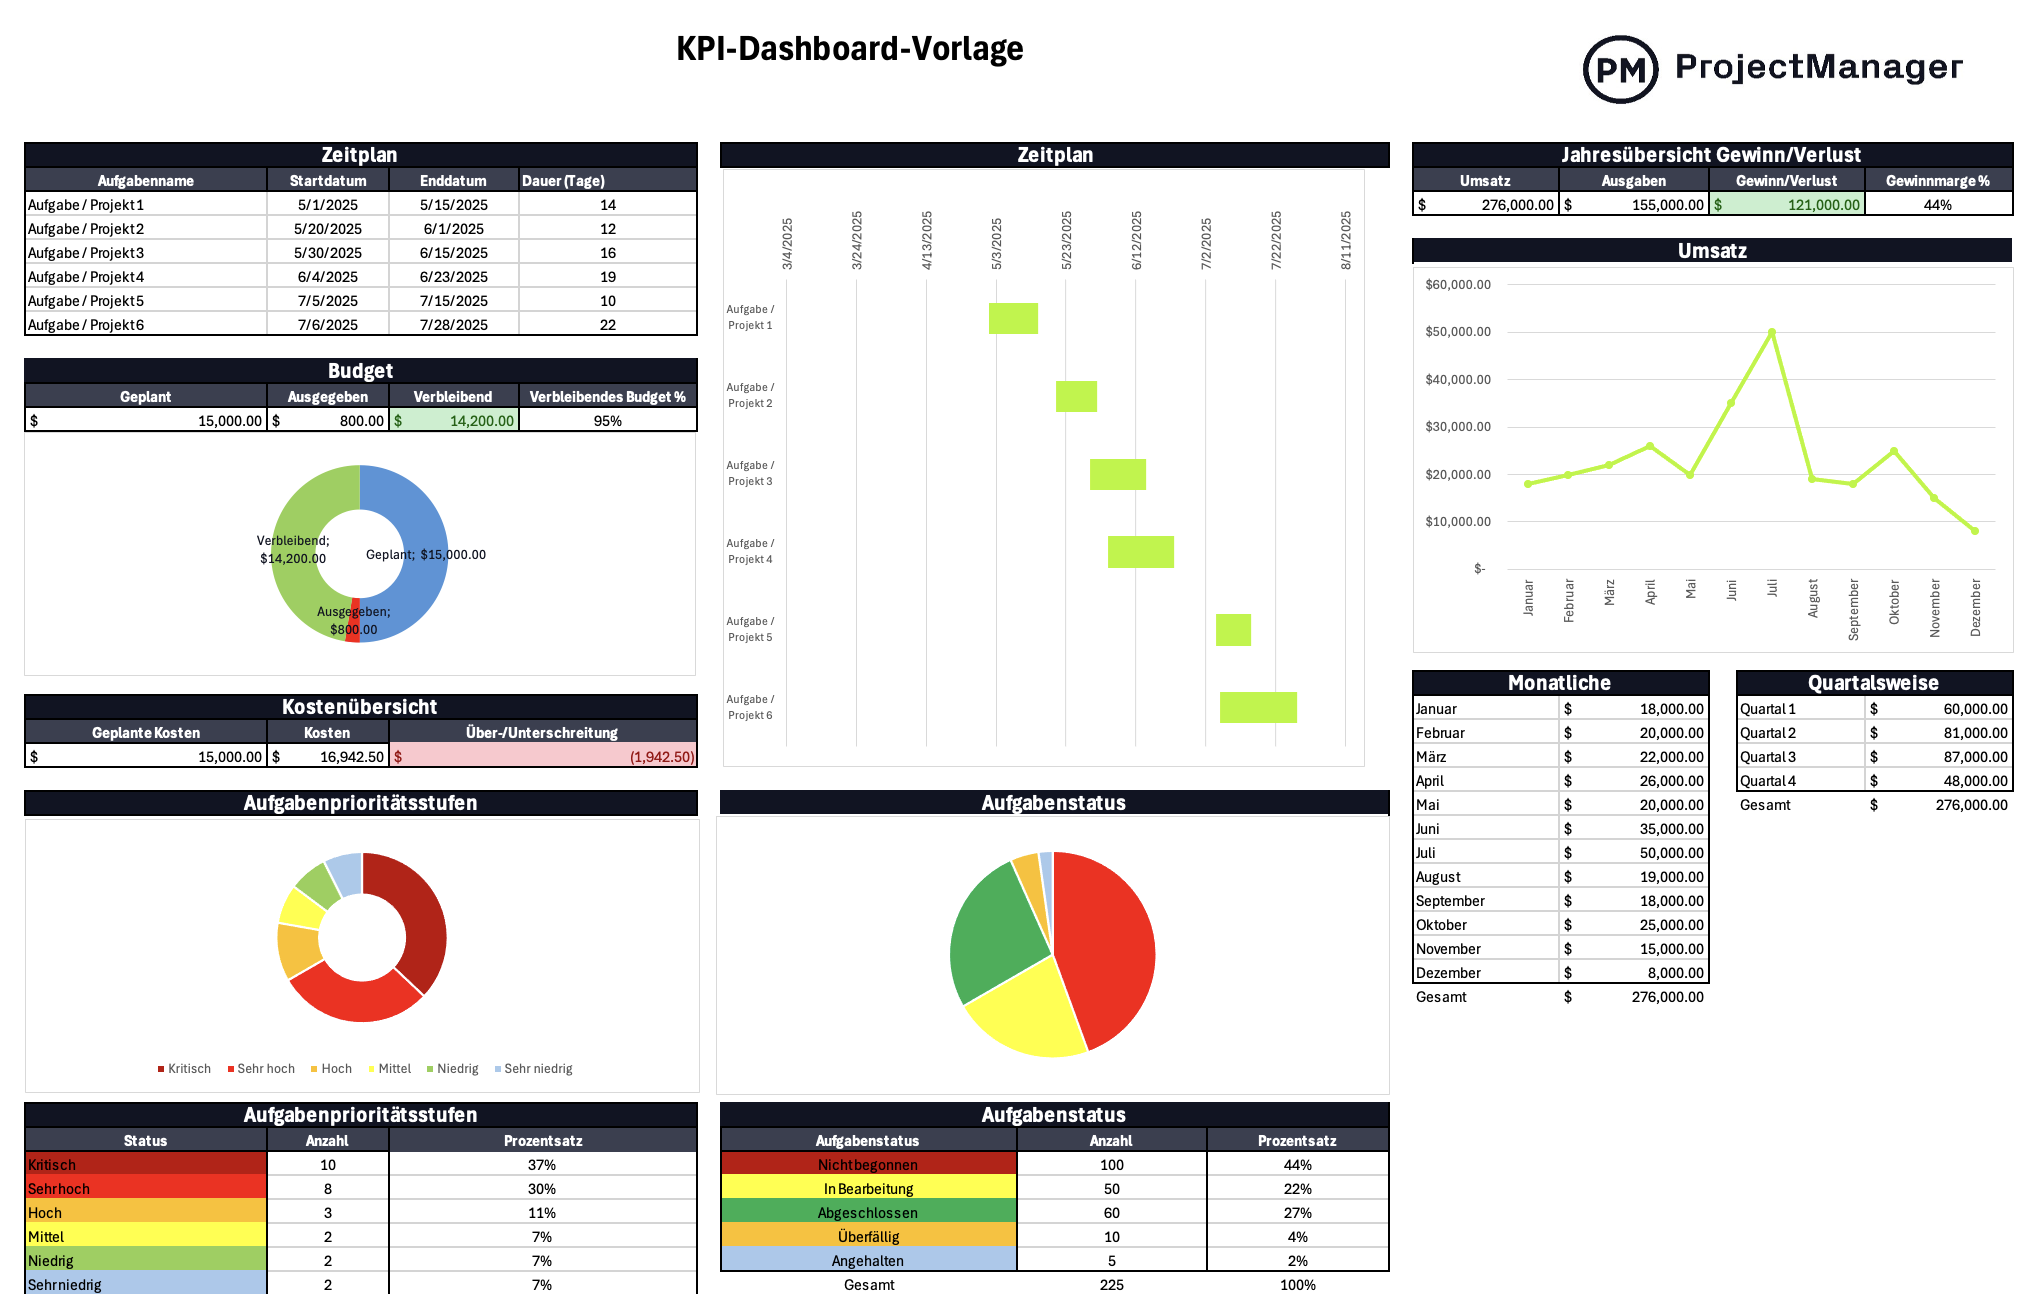
-
The Task-Tracker Dashboard Template
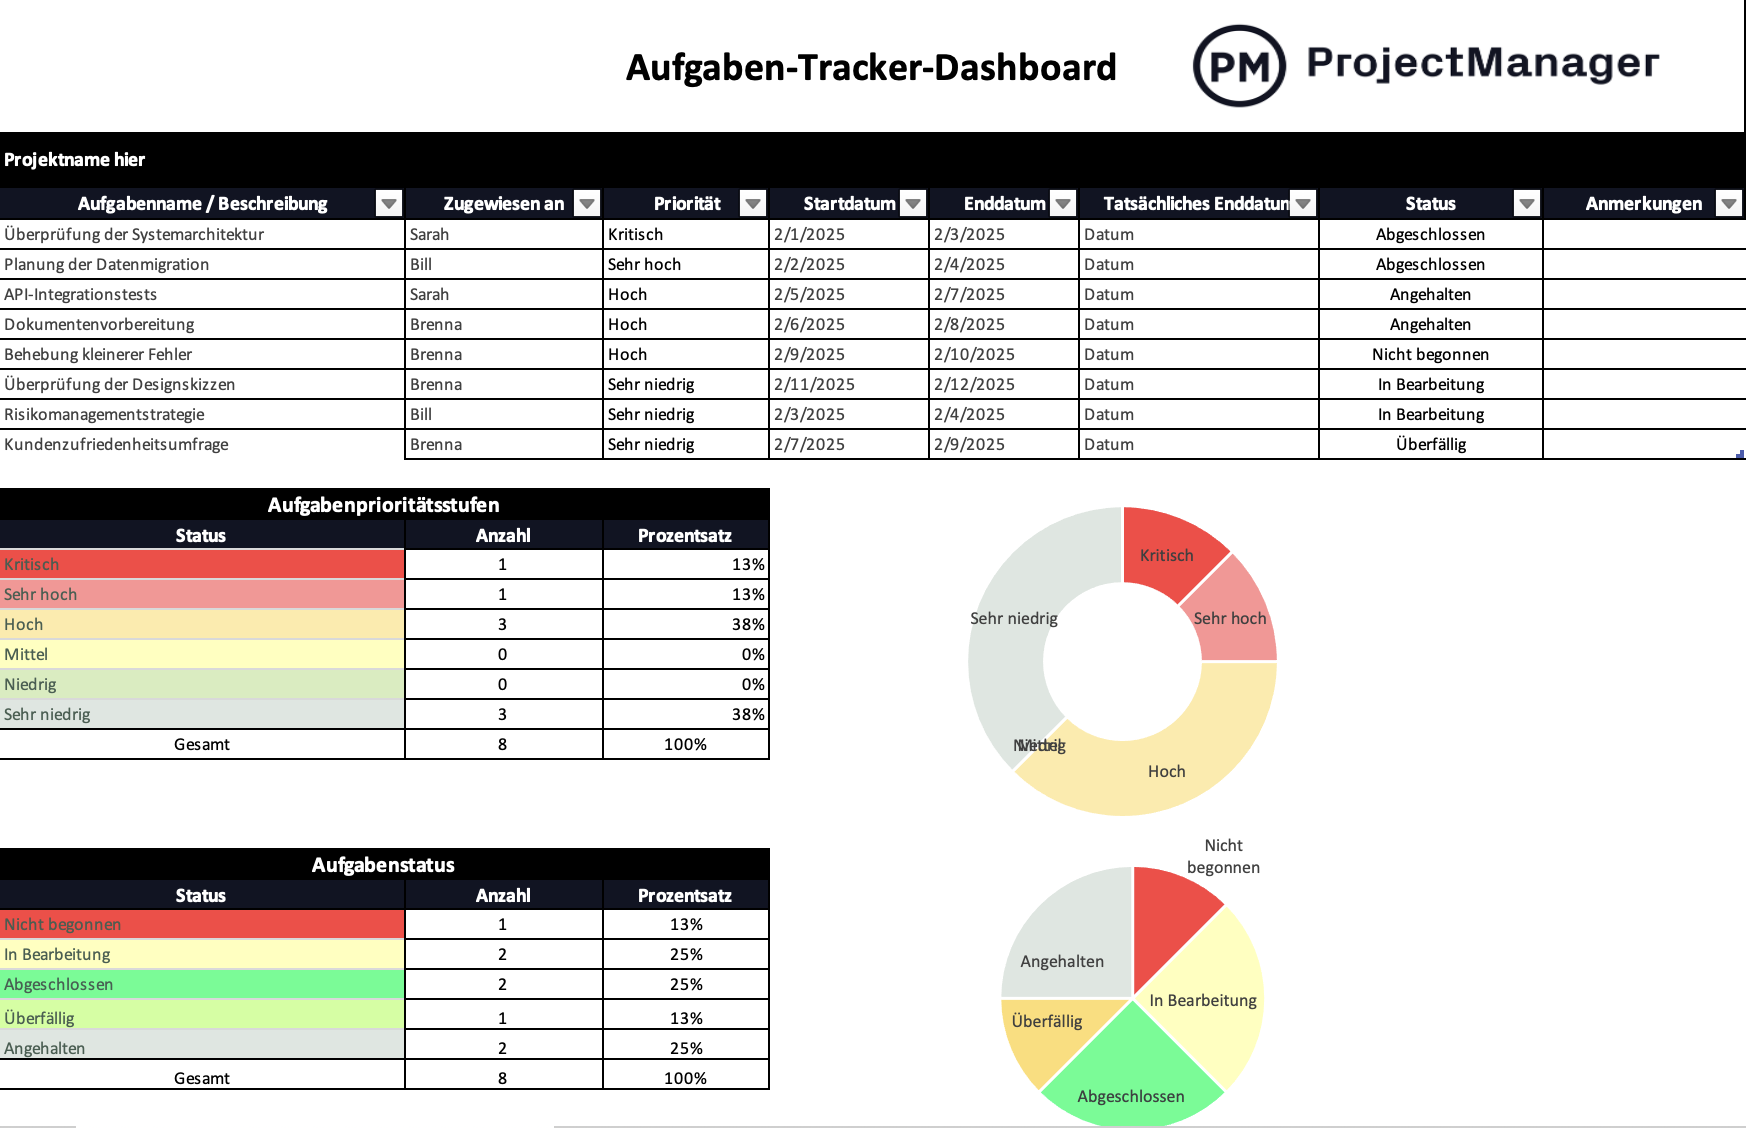
Operational efficiency hinges on clear task ownership and prioritization. The task-tracker template serves as a centralized hub for monitoring individual deliverables. It incorporates structured matrices that rank tasks by priority—ranging from very low to critical—alongside status indicators spanning pending and uninitiated workflows. These inputs automatically populate visual percentage bars and categorical charts, ensuring team leads retain absolute clarity regarding accountability and impending deadlines. -
The Asset Management Dashboard Template
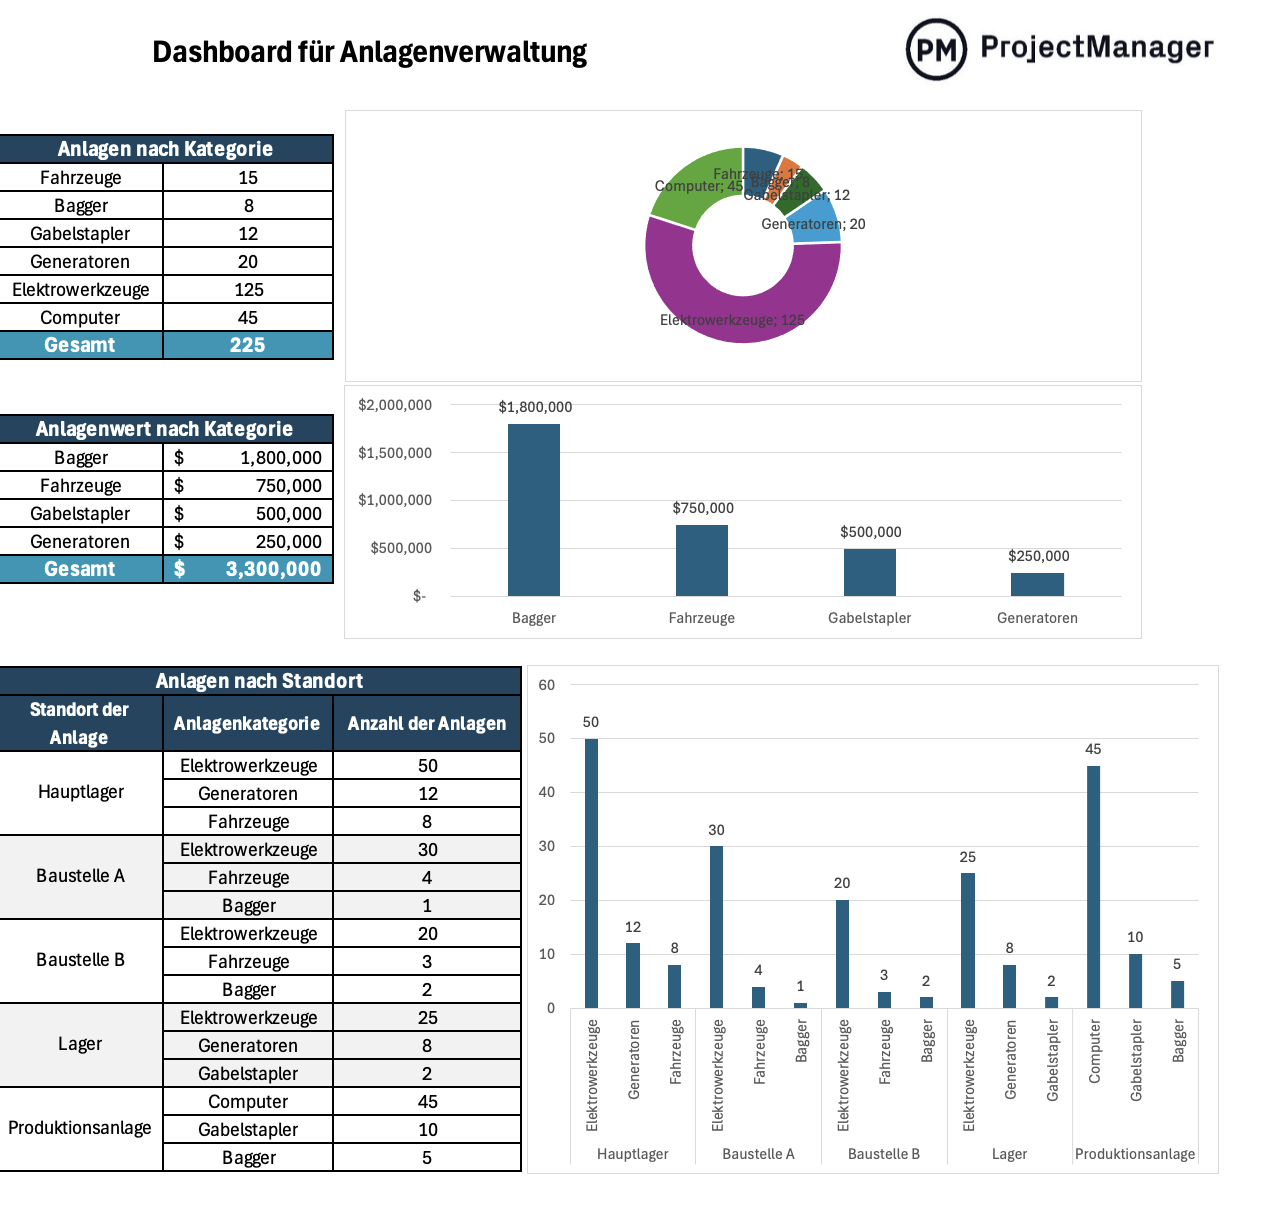
Beyond human capital and financial resources, physical inventory management remains a critical operational challenge. The asset management template consolidates inventory data into a single reporting interface, enabling teams to monitor asset quantities, financial valuations, and geographical distribution. Utilizing donut charts for category allocation and comparative bar graphs for asset value assessment, this framework supports long-term equipment maintenance strategies and procurement planning.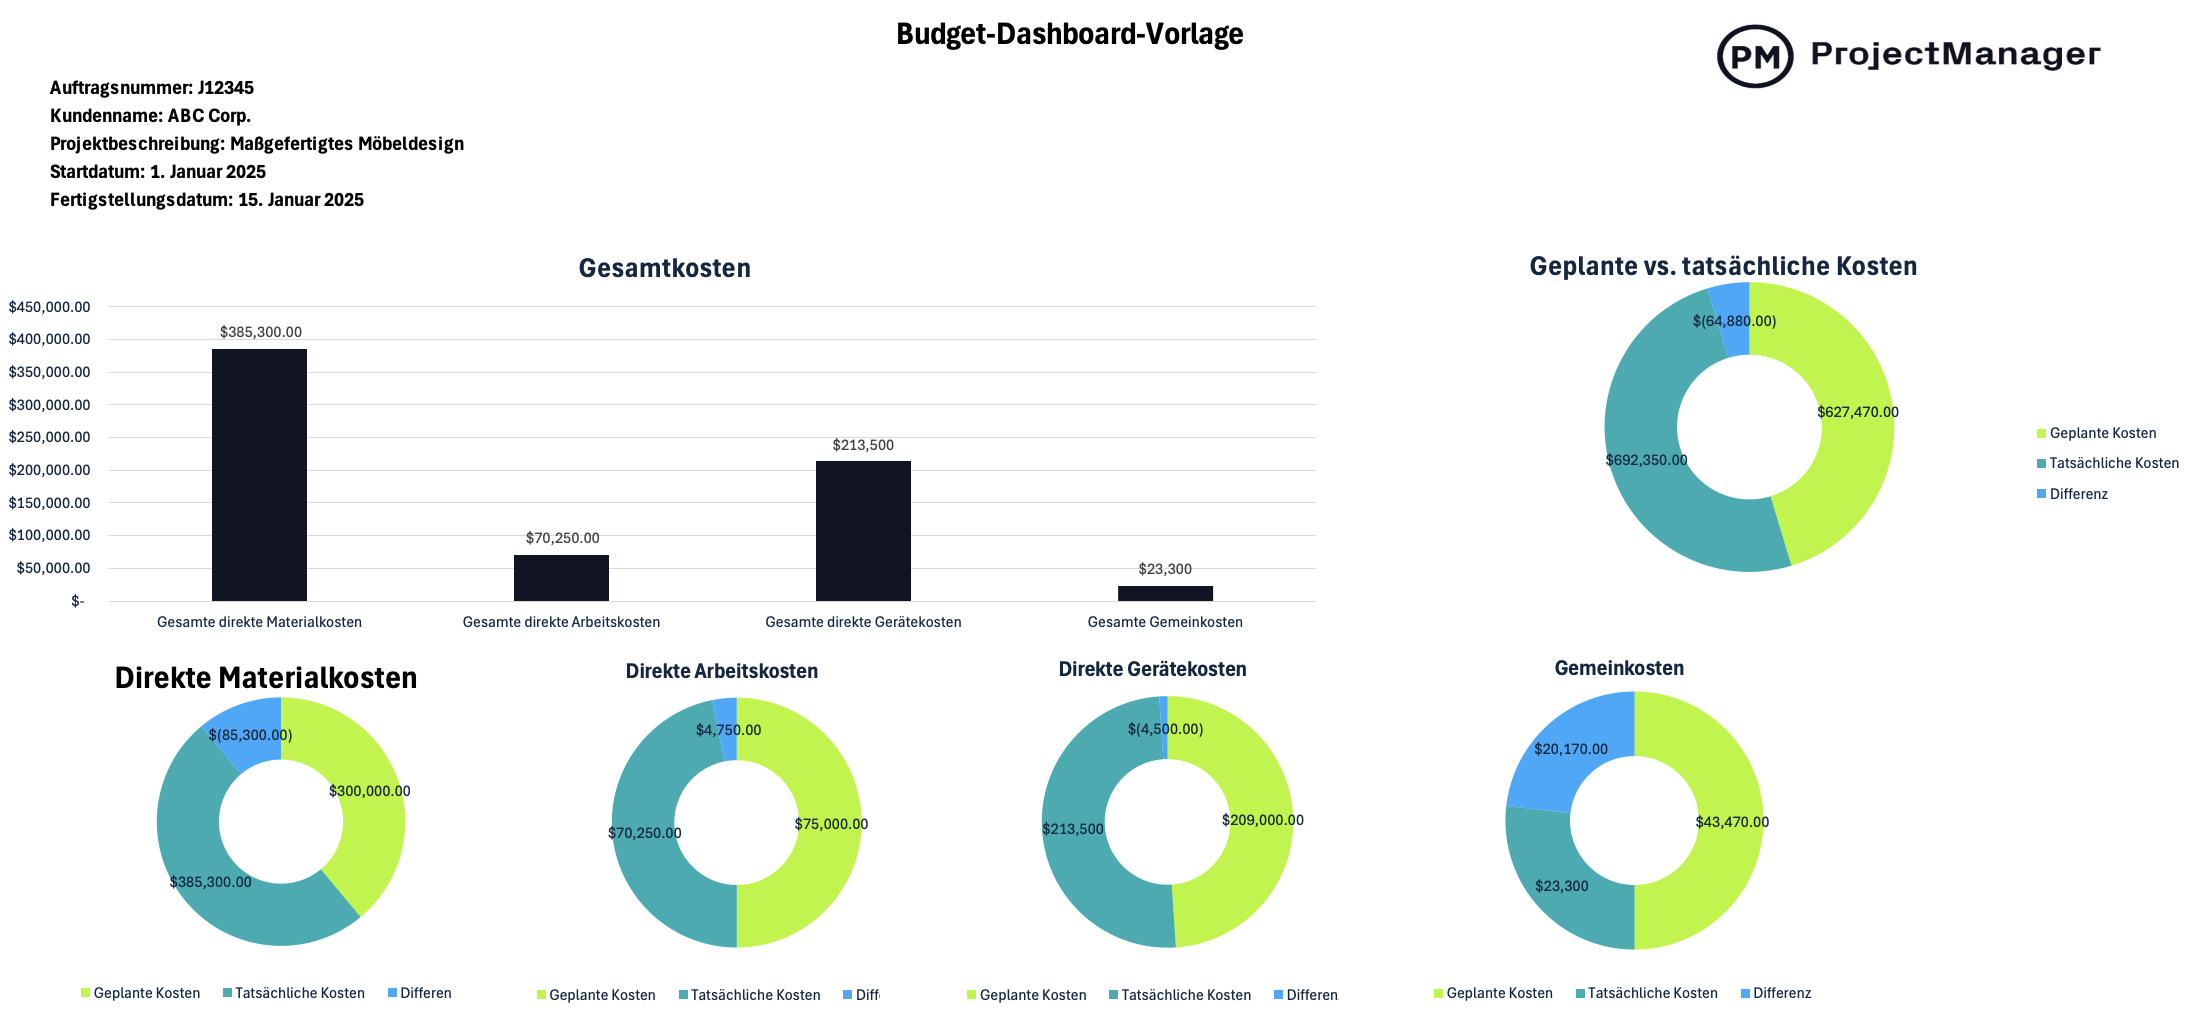
Comparative Analysis: Spreadsheets Versus Real-Time Software
While Excel templates offer significant utility, industry experts emphasize their structural limitations compared to dedicated project and portfolio management (PPM) software. Enterprise solutions—such as those developed by platform providers like ProjectManager—automate data collection through live cloud connectivity, eliminating the lag inherent in manual spreadsheet updates.
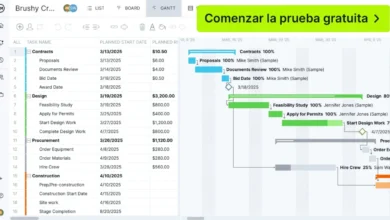
Furthermore, advanced software platforms integrate multiple planning perspectives, including dynamic Gantt charts with critical path filtering, Kanban boards for agile workflows, and automated timesheets that streamline payroll and resource utilization tracking. Enterprise tools also offer robust collaboration features, secure file storage, automated risk management notifications, and version control mechanisms that static Excel files cannot replicate.
Implications for Modern Organizations and Future Outlook
The availability of standardized, free dashboard templates underscores a broader industry trend toward democratized project management tools. Organizations of all sizes face increasing pressure to optimize operational efficiency while keeping administrative overhead low. By utilizing Excel-based dashboards as an initial diagnostic and tracking mechanism, companies can establish disciplined data-collection habits before scaling up to automated enterprise environments.
Ultimately, these templates serve as an accessible entry point for teams seeking to improve accountability, financial oversight, and resource allocation. Whether utilized as a permanent solution for smaller projects or as a transitional stepping stone toward cloud-based portfolio management, structured templates remain a cornerstone of professional operational strategy in the modern business landscape.