The Ultimate Guide to Calculating and Leveraging Net Promoter Score for Business Growth

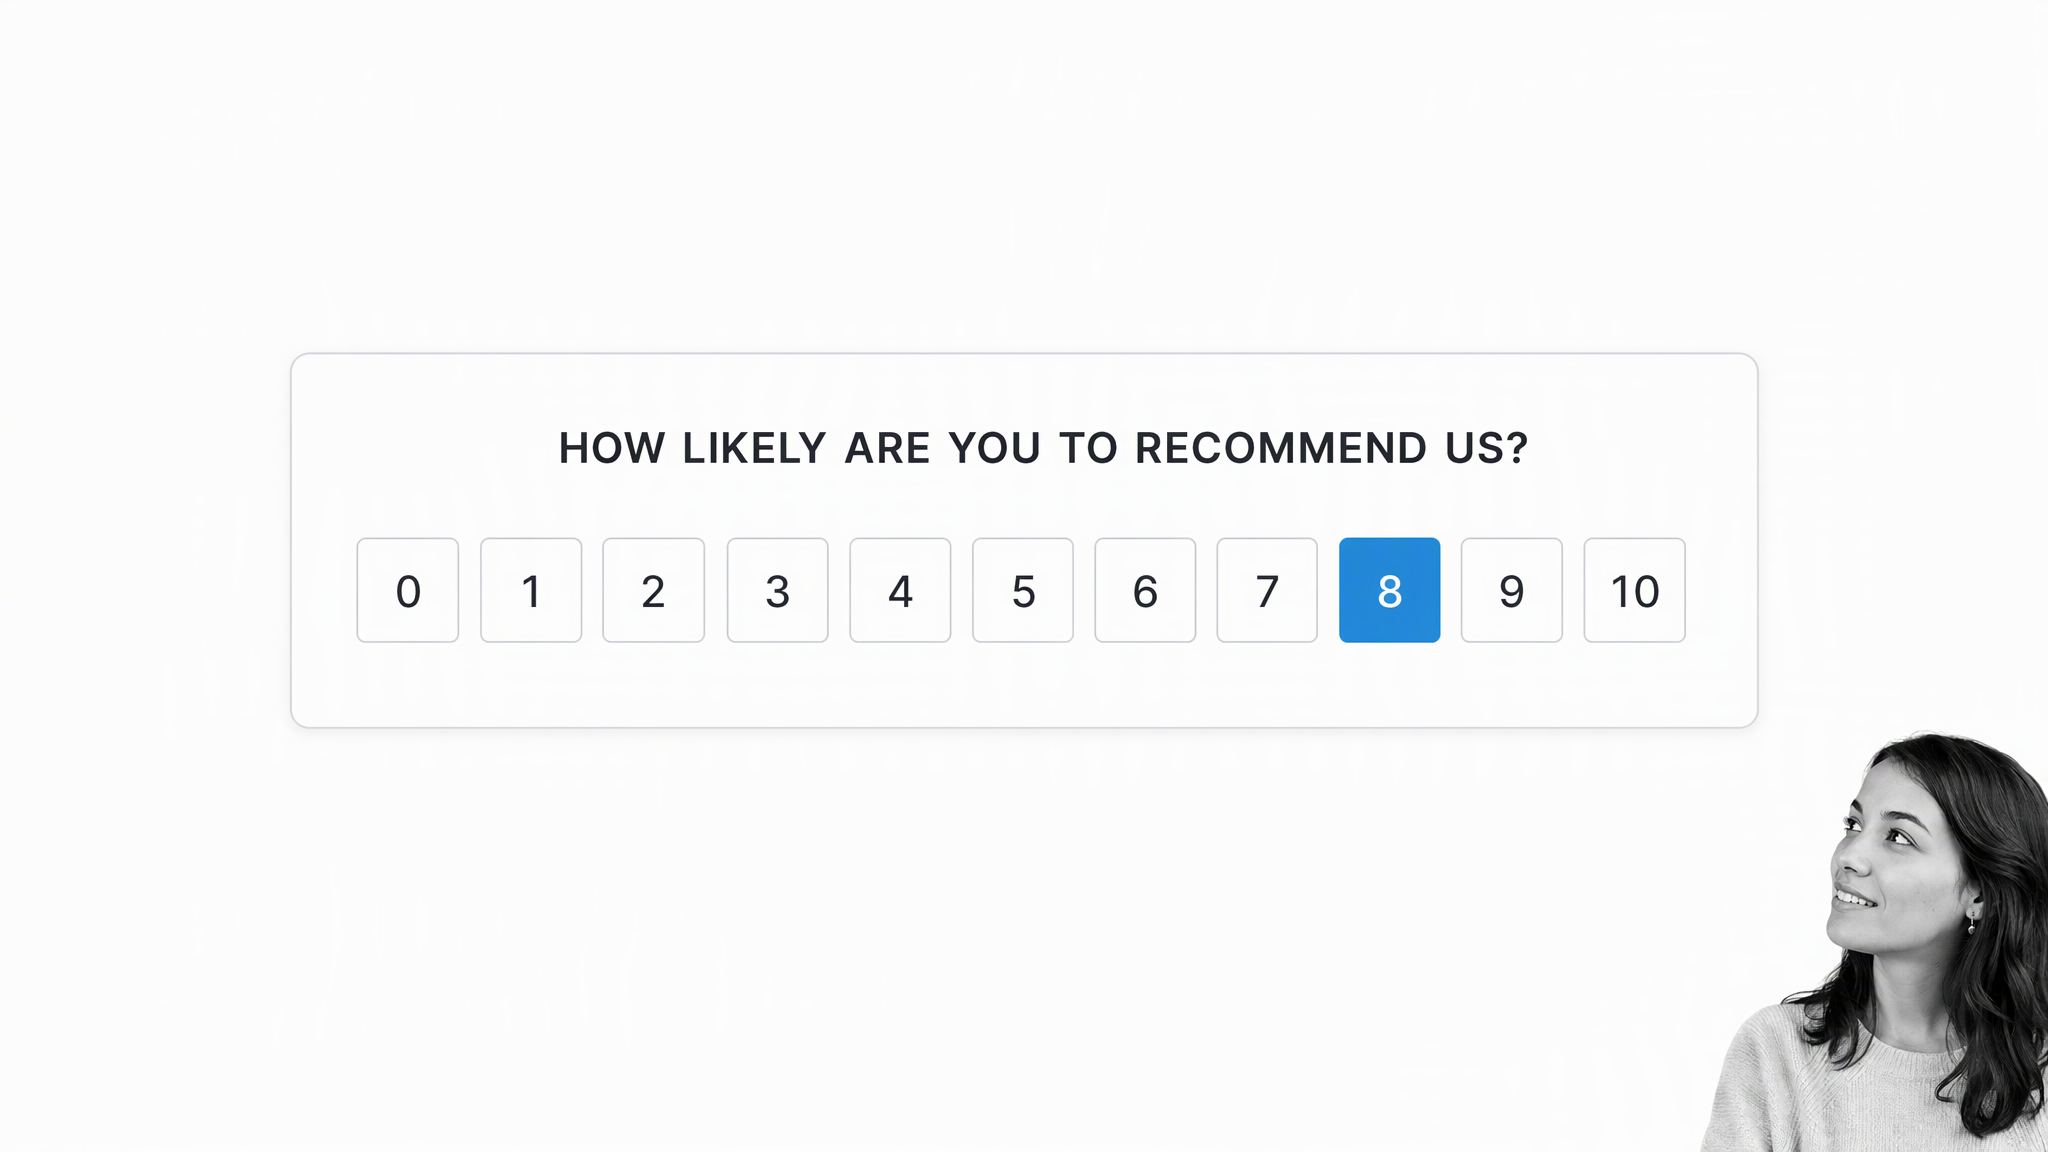
Net Promoter Score (NPS) has evolved from a niche analytical experiment into a cornerstone metric for modern customer success, providing organizations with a standardized barometer for measuring brand loyalty and customer sentiment. Developed in the early 2000s by Fred Reichheld of Bain & Company, the metric was introduced to address the limitations of traditional, complex customer satisfaction surveys. By distilling the multifaceted concept of loyalty into a single, actionable question—"How likely are you to recommend us to a friend or colleague?"—NPS offers a universal language for business health that spans industries from SaaS to retail.
At its core, NPS is not merely a number between -100 and +100; it is a diagnostic tool that highlights the gap between customer expectation and actual experience. As market competition intensifies, the ability to derive high-fidelity insights from this metric has become a defining characteristic of market leaders. Achieving a representative signal, however, requires more than just distributing a survey; it demands a rigorous approach to timing, representative sampling, and a robust operational framework to translate feedback into tangible product or service improvements.
The Anatomy of the NPS Metric
To understand the mechanics of NPS, one must first recognize the structure of the standard survey. The process begins with the prompt: "On a scale of 0 to 10, how likely are you to recommend our company to a friend or colleague?" The scoring system divides respondents into three distinct cohorts, each representing a different relationship with the brand.
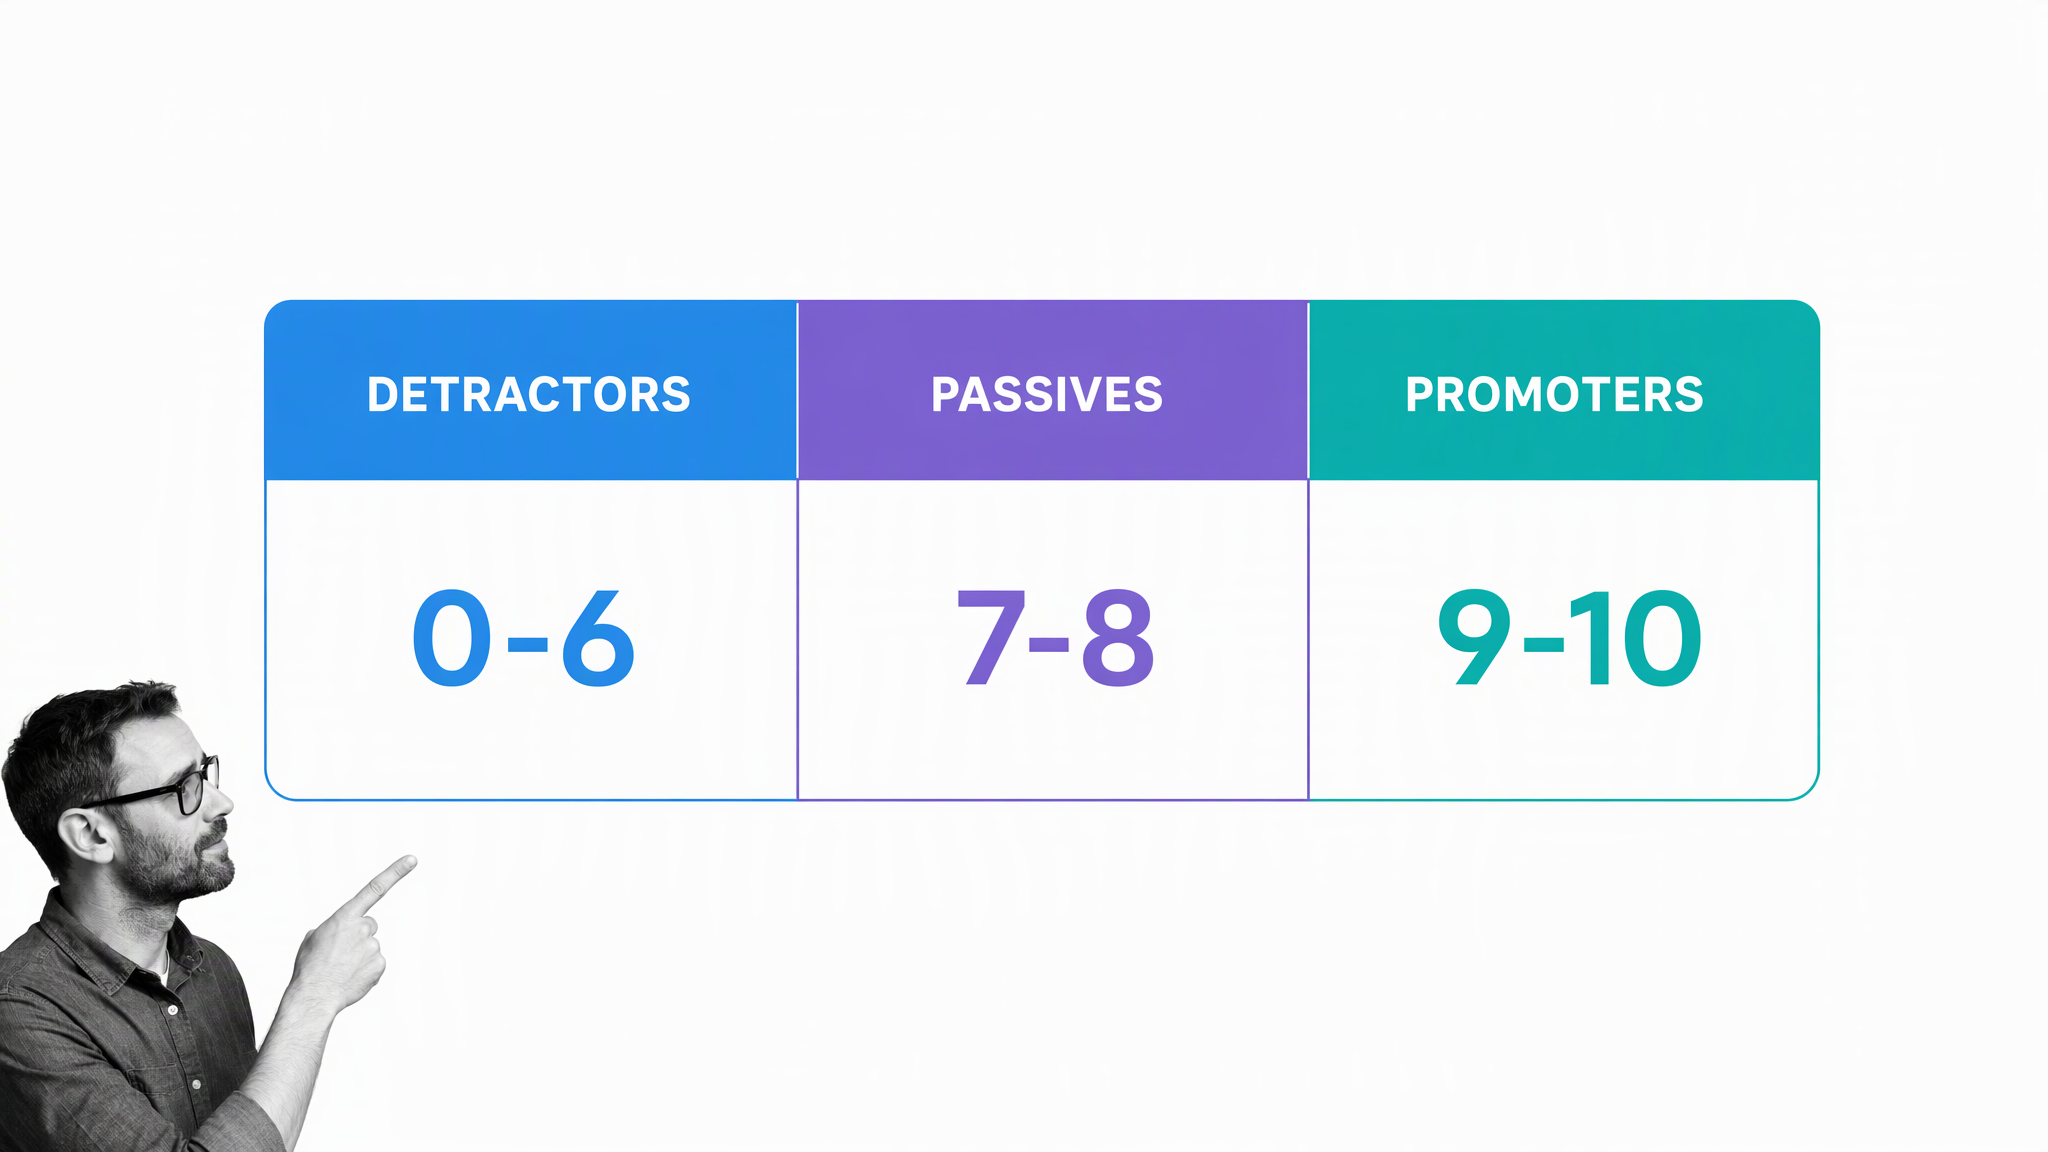
- Promoters (Score 9–10): These are the organization’s most valuable advocates. They exhibit high levels of satisfaction, are likely to remain loyal, and serve as a source of organic growth through referrals and positive social proof.
- Passives (Score 7–8): These customers are generally satisfied but unenthusiastic. They are vulnerable to competitor offerings because they lack a deep emotional attachment to the brand. While they do not actively detract from the brand, they are unlikely to promote it.
- Detractors (Score 0–6): These individuals represent a significant risk to the business. Their scores indicate dissatisfaction that, if left unaddressed, can lead to churn and negative word-of-mouth, which can erode brand equity over time.
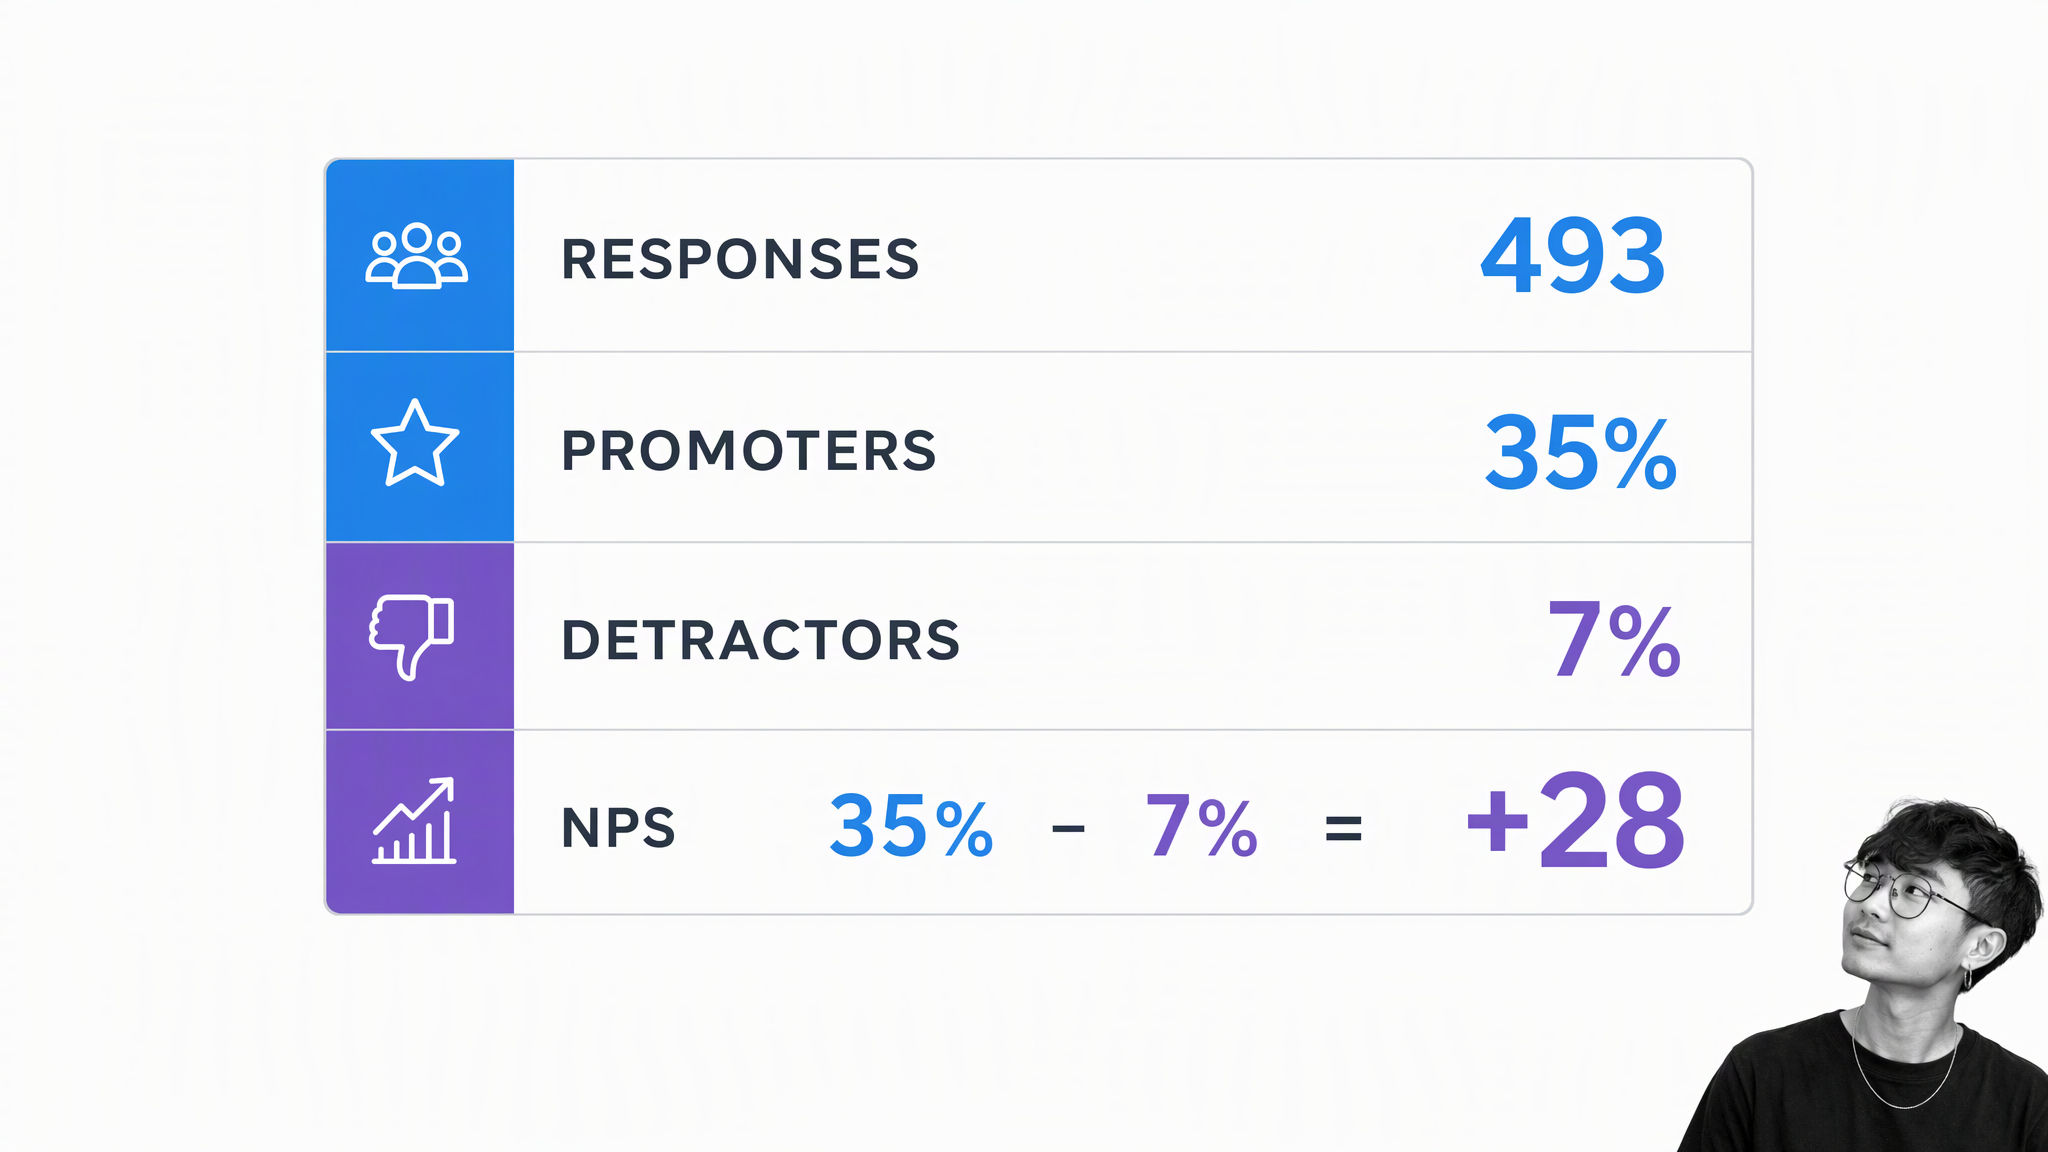
The formula for calculating the final score is the percentage of Promoters minus the percentage of Detractors. It is critical to note that Passives, while included in the total respondent count, are effectively neutralized in the final calculation. Their presence, however, is essential for the integrity of the data; they act as a "buffer" that prevents the score from being skewed by extremes. For instance, in a survey of 1,000 respondents, if 500 are Promoters (50%) and 200 are Detractors (20%), the resulting NPS is +30.
Strategic Implementation and Data Collection
The efficacy of NPS relies heavily on the environment in which the data is gathered. Organizations often struggle with "survey fatigue," where an over-saturation of requests leads to low response rates and skewed, unrepresentative data. To mitigate this, companies are increasingly moving toward event-driven or transactional surveys.
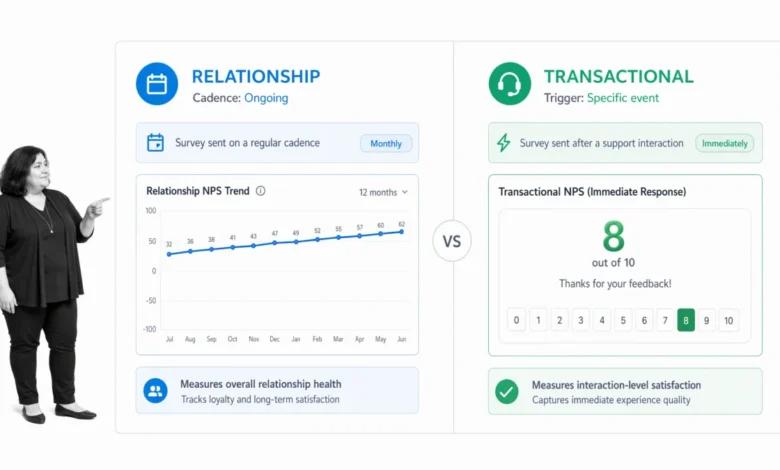
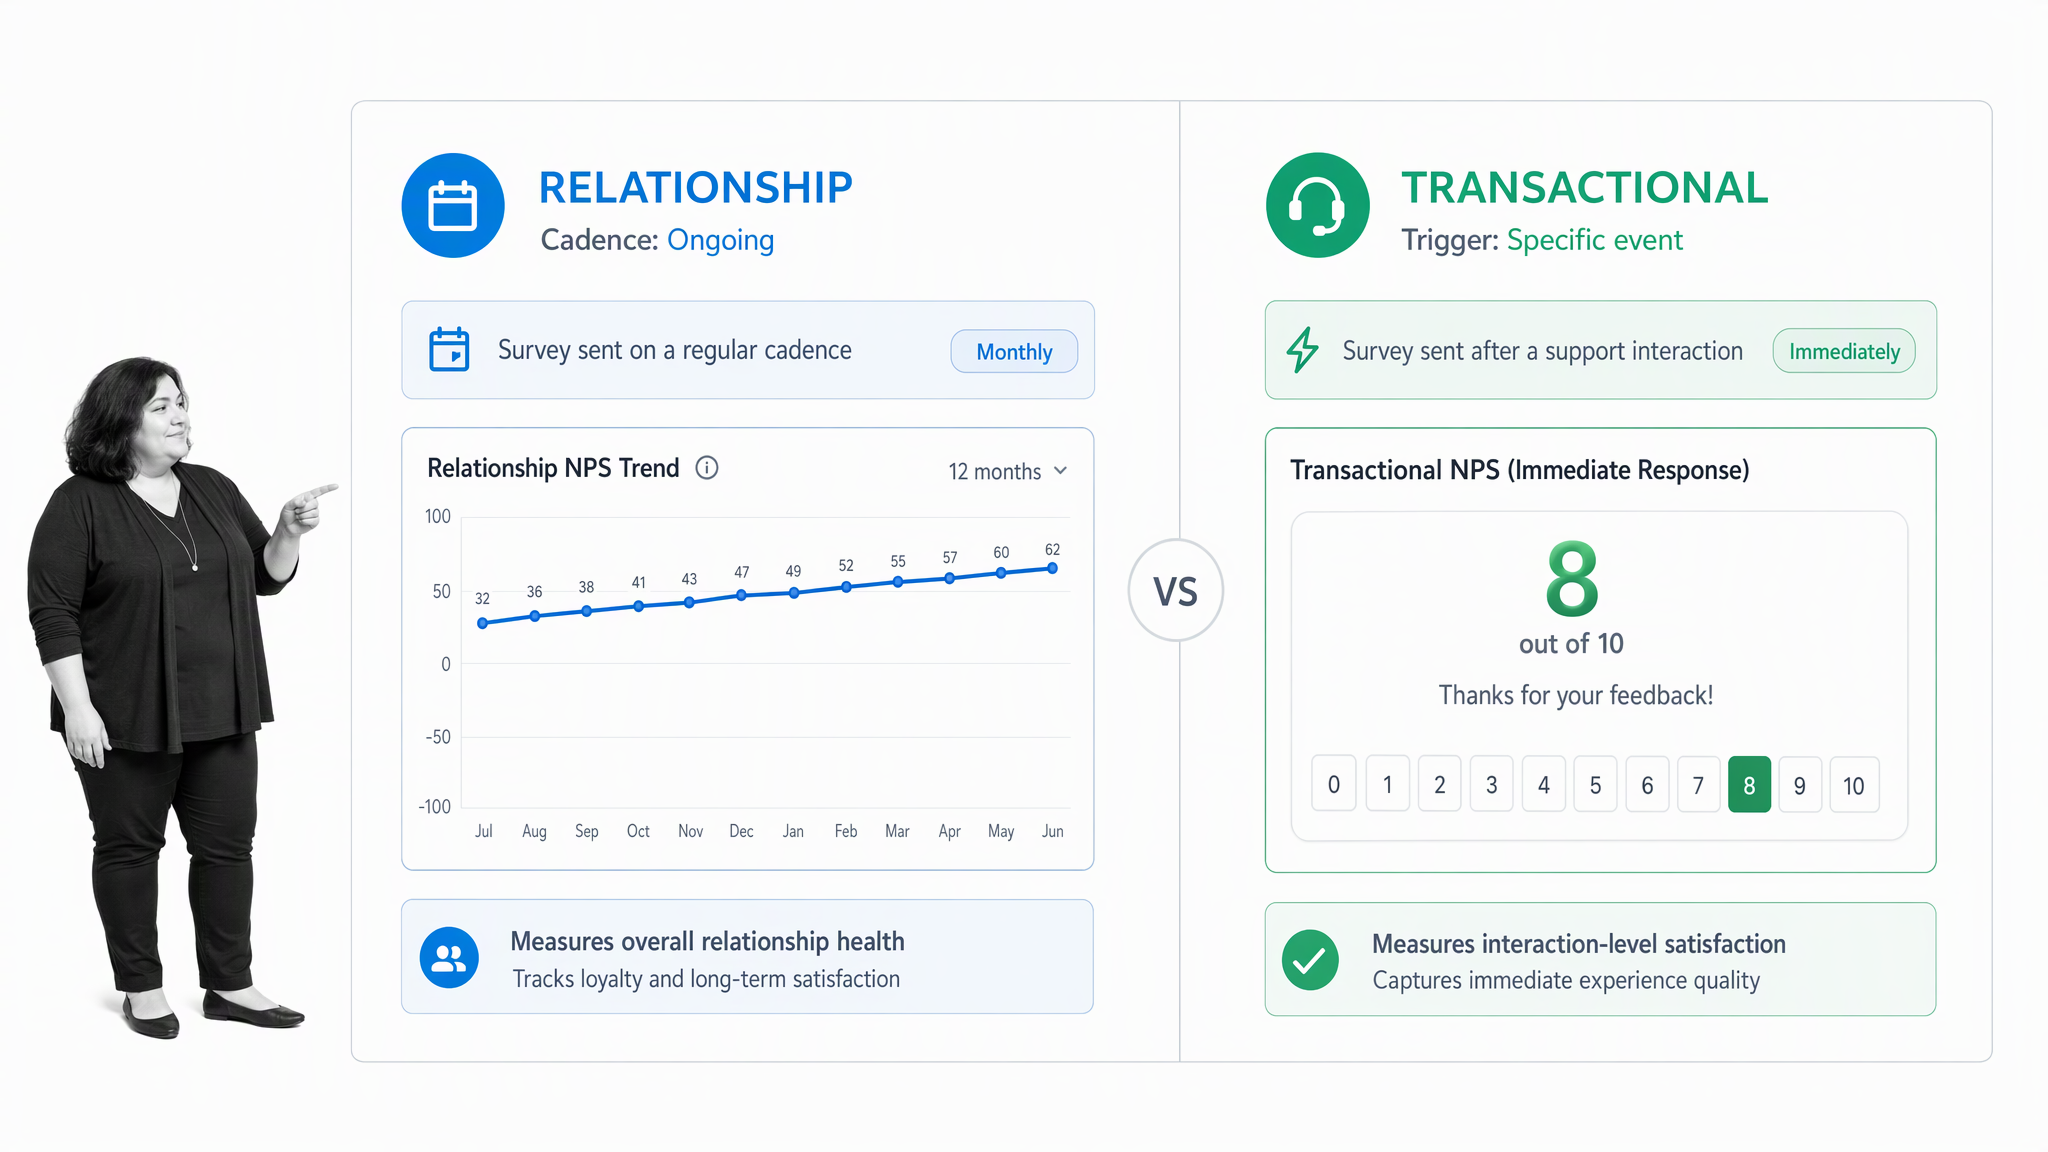
A transactional survey—triggered by a specific event like the resolution of a support ticket, a product onboarding milestone, or a contract renewal—provides immediate insight into a discrete experience. In contrast, relationship surveys are typically sent at regular intervals, such as quarterly or bi-annually, to assess the broader, long-term health of the customer relationship. By segregating these two methodologies, teams can distinguish between localized operational issues and high-level brand perception.
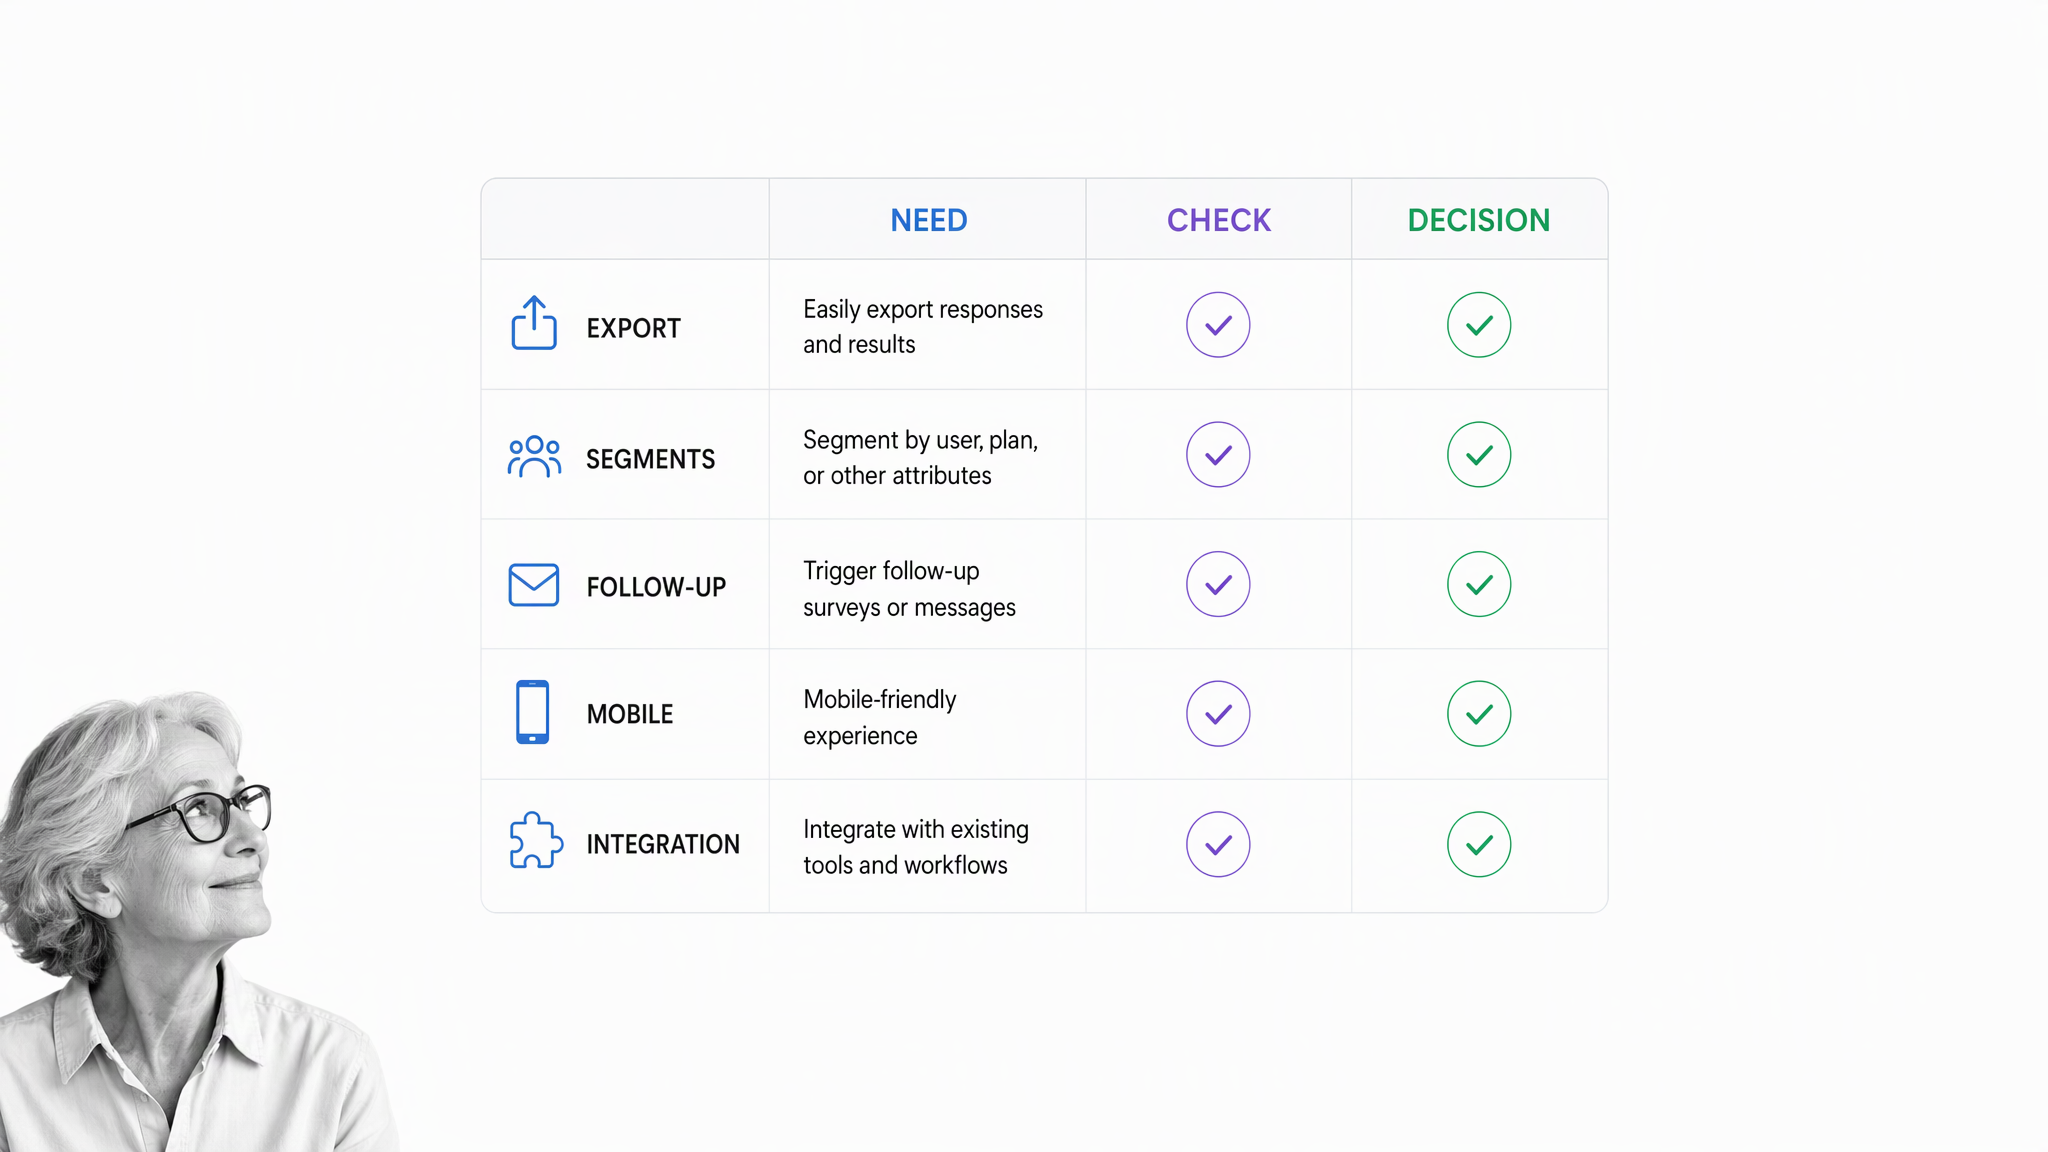
Modern survey platforms, ranging from Typeform and SurveyMonkey to integrated solutions like Intercom, have made the deployment of these surveys seamless. However, the technical ease of distribution should not obscure the necessity of proper methodology. Best practices dictate that the survey interface must be optimized for mobile, offer a simple one-click response for the initial score, and include a single, open-text field for qualitative context. The qualitative data—the "why" behind the score—is arguably more valuable than the quantitative integer, as it provides the specific narrative required for operational remediation.
The Role of Data Segmentation and Benchmarking
A common pitfall in NPS analysis is the obsession with the "headline score" without sufficient context. An NPS of +40 might be considered stellar in the software industry, where competitive churn is high, while the same score might be mediocre in a sector with higher barriers to entry and less competition. Consequently, organizations must prioritize internal benchmarking, tracking their own performance across specific cohorts over time.
Segmentation is the bridge between a static score and business strategy. By breaking down NPS results by customer persona, account size, tenure, or geographic region, leadership teams can identify specific pockets of success or failure. For example, a company might find that while their enterprise clients are highly satisfied, their SMB segment is reporting high levels of detachment. This level of granularity allows for targeted interventions rather than broad, inefficient policy changes.
Turning Feedback into Operational Action
The true value of NPS is only realized when the feedback loop is closed. In many organizations, the collection of NPS data is treated as a vanity project, but leading firms integrate these insights directly into their compliance and customer success operations.
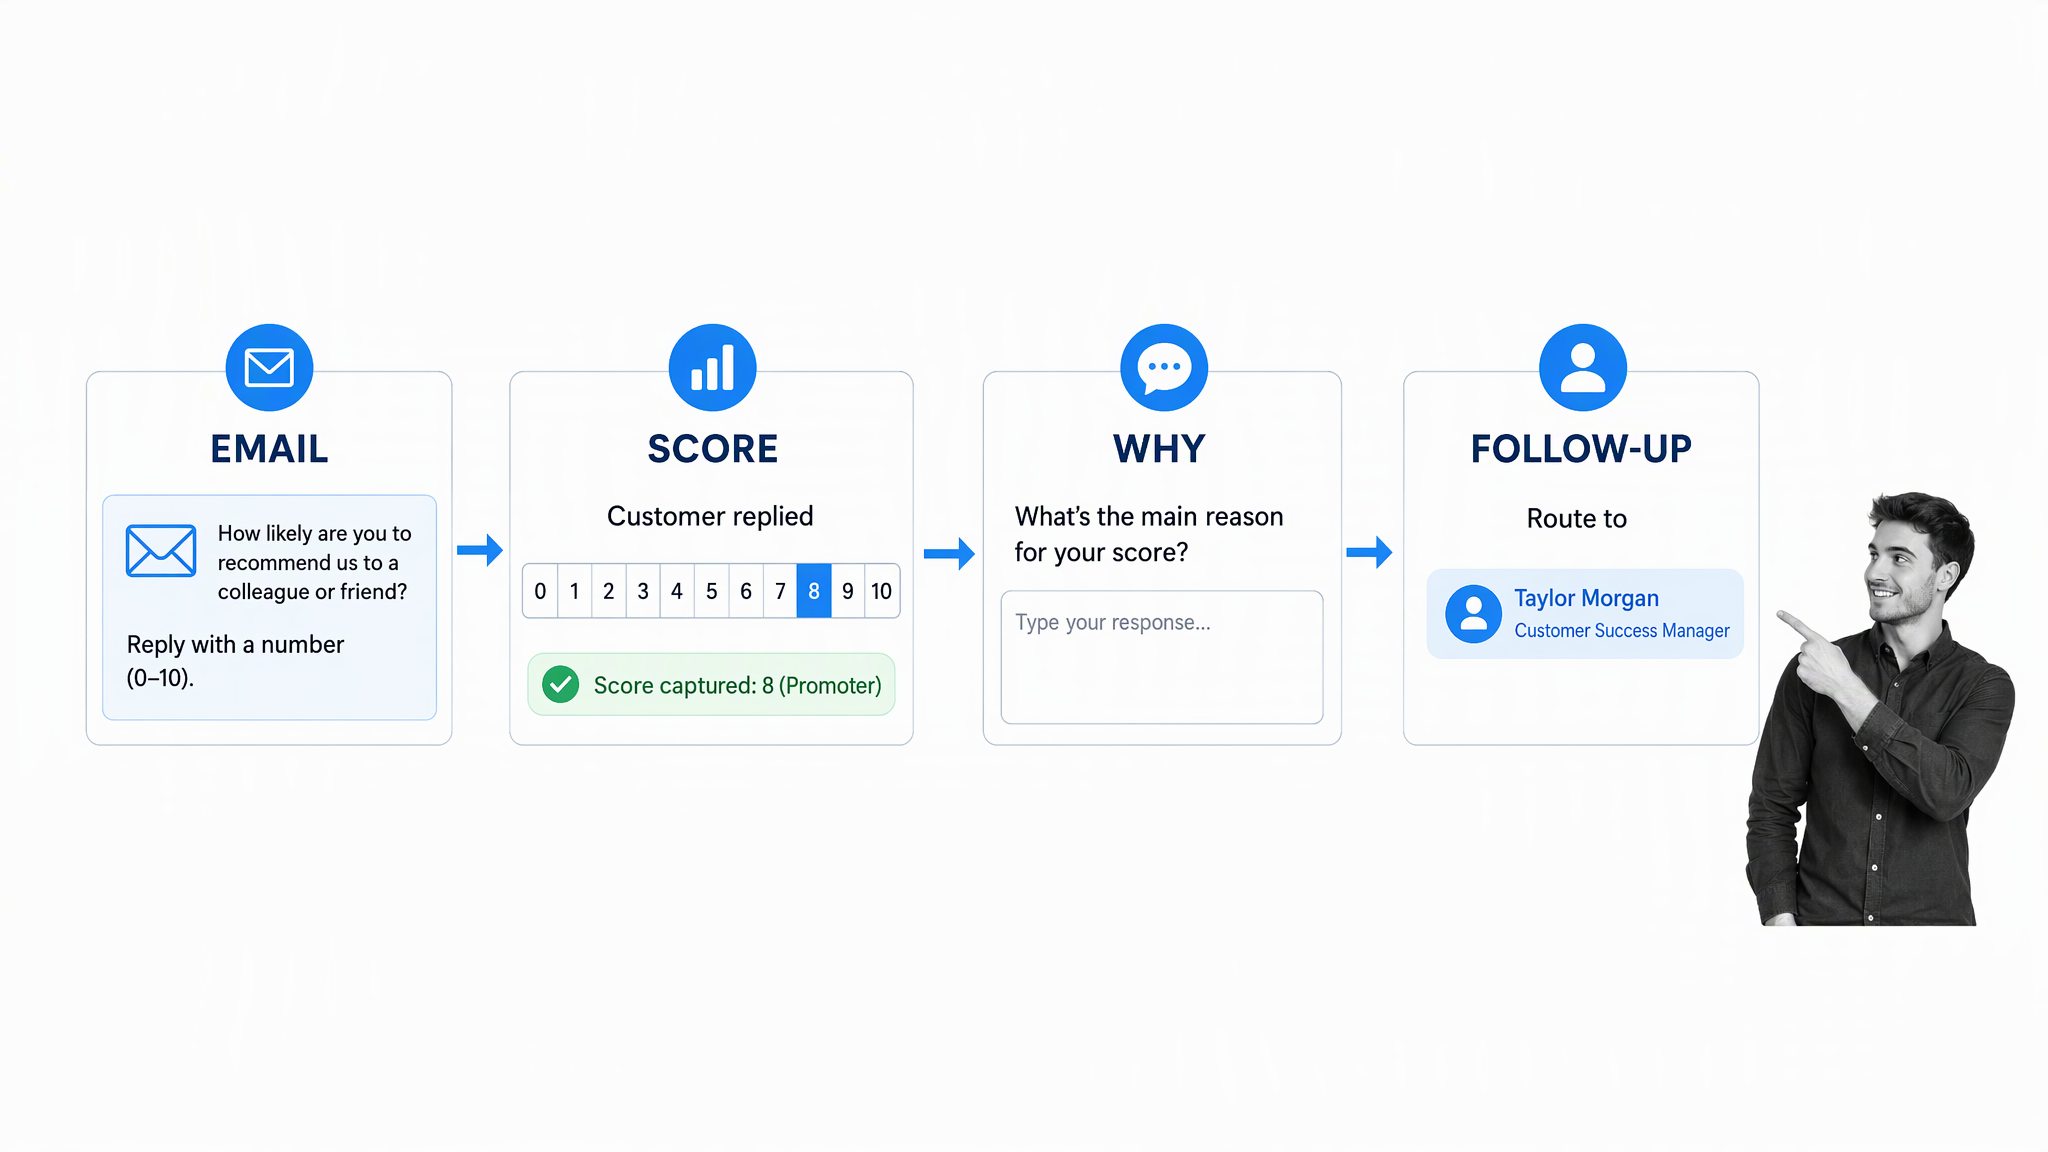
When a Detractor provides a response, the most effective workflow involves immediate notification to a dedicated account manager or success team. Using platforms like Process Street, organizations can automate the routing of these responses, ensuring that negative feedback is addressed within a set service-level agreement (SLA). This transformation of "complaint into a task" is what differentiates companies that merely measure sentiment from those that improve it.
Furthermore, summarizing recurring feedback themes provides a roadmap for product development. If 40% of Detractors cite "difficult navigation" as their primary reason for a low score, the product team has a clear, data-backed mandate to prioritize UI improvements. This alignment between customer feedback and product roadmap is the hallmark of a customer-centric organization.
Broader Implications and Future Trends
As we look toward the future of customer sentiment analysis, the integration of Artificial Intelligence (AI) is set to redefine how NPS is processed. Natural Language Processing (NLP) can now automatically categorize thousands of open-text responses, identifying shifts in sentiment trends that a human analyst might miss. This allows for real-time monitoring of customer health rather than retrospective reporting.
Despite these advancements, the fundamental principle remains unchanged: NPS is a proxy for human emotion. The transition from traditional math—which relies on revenue or bounce rates—to psychological metrics requires a shift in mindset. Organizations must acknowledge that while revenue measures the transaction, NPS measures the relationship.
In summary, calculating Net Promoter Score is a foundational activity that requires consistency and discipline. The goal is not to achieve a perfect 100, but to foster a culture of listening and responsiveness. By maintaining a stable survey cadence, rigorously segmenting data, and ensuring that every score triggers a documented follow-up process, businesses can turn a simple survey into a powerful engine for sustainable growth. As market volatility continues, the organizations that prioritize this level of customer intimacy will likely be the ones that secure the long-term loyalty necessary to thrive in an increasingly crowded global marketplace.