Decoding the 2018 Private SaaS Company Survey Part 2 Insights on Operations Churn and Capital Efficiency


The release of Part 2 of the sixth annual private Software-as-a-Service (SaaS) company survey—conducted in partnership between industry analysts and KBCM Technology Group, formerly known as Pacific Crest Securities—marks a significant milestone in software industry benchmarking. Following the initial rollout of Part 1, which heavily evaluated growth trajectories, go-to-market strategies, customer acquisition costs (CAC), and payback periods, this comprehensive second installment drills deep into the operational mechanics, infrastructure delivery models, gross margin realities, cost structures, retention dynamics, and capital efficiency of private SaaS enterprises.
For more than half a decade, this joint research initiative has served as the definitive litmus test for private cloud-based businesses seeking to measure their operational health against competitive industry standards. By compiling data from hundreds of survey respondents, the 2018 study provides a granular view of how modern B2B software companies manage everything from cloud hosting infrastructure and sales commission rates to gross dollar churn and adherence to the coveted "Rule of 40%."
Evolution of SaaS Infrastructure and Cloud Delivery Trends
One of the most profound structural shifts highlighted in the 2018 survey data revolves around how SaaS applications are deployed and delivered to end-users. The days of relying heavily on self-managed, on-premise hardware infrastructure have effectively become a relic of the past, preserved primarily among the largest and most legacy-bound software vendors.
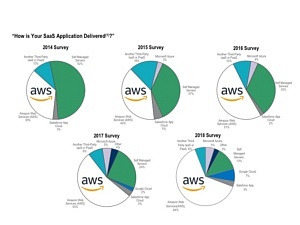
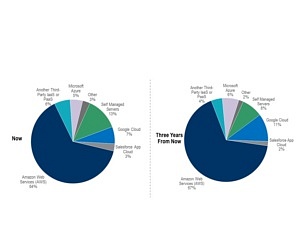
According to the findings, an overwhelming 87% of survey participants rely predominantly on third-party application delivery infrastructure. Among those utilizing external cloud partners, nearly three-quarters leverage Amazon Web Services (AWS) as their core hosting environment. Other major cloud providers, including Microsoft Azure and Google Cloud, command smaller initial shares but exhibit broad distribution profiles among newer market entrants. Longitudinal data tracking delivery trends since 2014 underscores a steady, unyielding migration toward third-party hyperscalers, with AWS successfully maintaining its market dominance year over year.

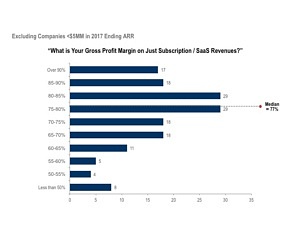
When segmented by company size, the data reveals that reliance on self-managed servers exists exclusively within the highest revenue tiers—specifically among organizations generating upwards of $40 million annually. Even within these mature enterprises, the adoption of AWS has accelerated sharply compared to previous survey cycles. Despite the variances in infrastructure preference, the report notes that median subscription gross margins remain remarkably consistent regardless of the underlying hosting provider, indicating that cloud migration decisions are driven primarily by scalability, security, and reliability rather than immediate gross margin optimization.

Professional Services, Sales Compensation, and Pricing Mechanics
Operational efficiency in SaaS requires a delicate balance between software licensing revenue and specialized professional services, particularly as companies scale upmarket to target larger enterprise clients. The survey data illustrates a predictable correlation: organizations deriving the vast majority of their revenue from major enterprise customers routinely exhibit significantly higher levels of professional services as a percentage of first-year Annual Recurring Revenue (ARR). Conversely, businesses focused on small-to-medium businesses (SMBs) and very small businesses (VSBs) maintain lean, product-led delivery models requiring minimal implementation services.

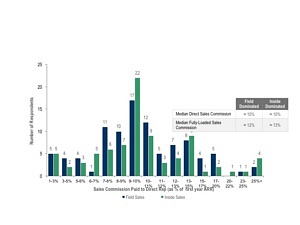
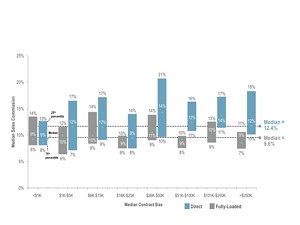
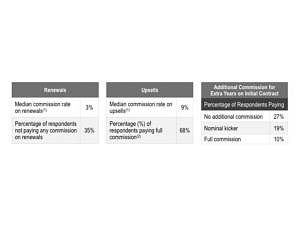
In examining sales compensation structures, the survey investigated whether median direct sales and fully-loaded commission rates varied across field versus inside sales models, or across different median contract sizes (Annual Contract Value, or ACV). Interestingly, the findings indicate no statistically significant variance in commission rates between field-heavy and inside-sales organizations, nor do commission percentages fluctuate drastically across different contract value tiers. Furthermore, when evaluating direct commissions for contract renewals, upsells, and multi-year expansions, many participating companies reported utilizing commission structures for renewals and upsells that mirrored or exceeded incentives offered on net-new sales, highlighting an increased organizational emphasis on net revenue retention and account expansion.
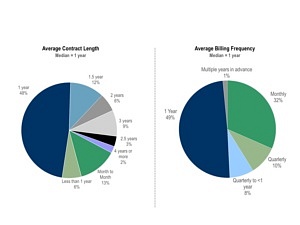
Regarding contract length and pricing architectures, data indicates that average contract terms naturally scale alongside median contract sizes. Companies commanding six-figure ACVs routinely secure multi-year commitments, whereas lower-value transactions lean toward annual or monthly billing intervals. Subscription pricing continues to be dominated by per-user metrics, though an expanding category of vendors utilizes hybrid metrics tied to consumption, database size, or specific financial benchmarks.
Retention Realities: Gross Churn, Logo Churn, and Net Dollar Retention
Retention metrics remain among the most closely scrutinized performance indicators within the SaaS ecosystem. In the 2018 survey, researchers updated their data-collection methodology for gross dollar churn, transitioning from self-reported categorical ranges to a precise, calculated median gross dollar churn rate of 13.2% for the preceding 2017 calendar year. Similarly, direct reporting on annual logo churn yielded a higher median unit churn rate than previous iterations, reflecting more rigorous self-evaluation by participating firms.
Despite a calculated gross dollar churn median of 13.2%, the aggregate data concerning annual net dollar retention from existing customers demonstrated remarkable stability, with the median SaaS enterprise maintaining net retention at approximately 102%. This indicates that successful cross-sell, upsell, and expansion motions effectively offset the revenue lost through customer attrition.
A deeper cross-sectional analysis of the churn data reveals several foundational drivers of customer loyalty:
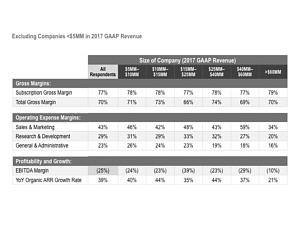
- Contract Duration: Enterprises enforcing longer contract lengths experience noticeably lower annual gross dollar churn rates.
- Upfront Professional Services: Organizations implementing structured onboarding and professional services packages report superior customer retention, suggesting that initial implementation support drastically reduces early-stage customer friction.
- Contract Size: Higher ACV cohorts exhibit lower gross churn, while organizations operating in the sub-$5K ACV tier face disproportionately severe headwinds from customer turnover.
- Distribution Strategy: Companies relying primarily on field sales channels record lower median annual gross dollar churn rates compared to those depending predominantly on inside sales, internet-led self-service, or mixed distribution models.
Capital Efficiency, Debt Financing, and the Rule of 40%
Navigating capital requirements is an existential challenge for private SaaS companies scaling toward profitability. The survey introduced refined metrics tracking "capital consumed"—defined as cumulative primary equity raised plus total debt drawn, adjusted for cash reserves and dividends—to establish an accurate, apples-to-apples comparison of capital efficiency.
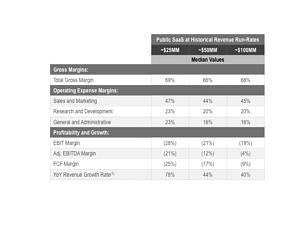
Across participating firms generating over $5 million in ARR, the median capital consumption ratio sits at roughly 1.5x. Notably, this ratio remains remarkably sticky and does not show meaningful, sustained declines until companies achieve immense commercial scale exceeding $75 million in ARR. Additionally, the strategic utilization of debt financing has emerged as a mainstream tool for growth-stage SaaS firms, with a significant percentage of respondents incorporating non-dilutive debt facilities into their capital stacks alongside traditional venture capital.
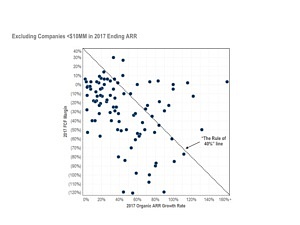
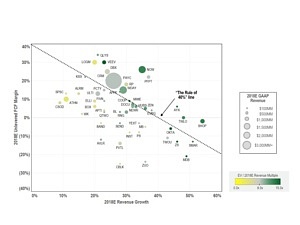
Perhaps one of the most widely discussed benchmarks evaluated in the 2018 study is the "Rule of 40%," which posits that a healthy SaaS company’s combined organic growth rate and free cash flow (FCF) margin should equal or exceed 40%. The survey findings revealed that only about 20% of participating private companies with over $10 million in ARR successfully met or exceeded this threshold, with the median participant recording a combined Growth plus Profitability (G+P) score of +8%.
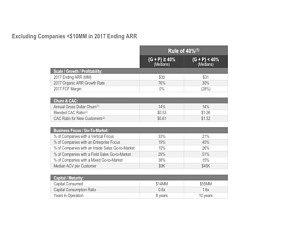
When comparing public market performance against private peers, the contrast is stark: public SaaS companies boast a median G+P of 33%, with approximately 70% of public SaaS market capitalization concentrated above the 40% threshold. A comparative breakdown of private firms achieving the Rule of 40% versus their peers indicates that top-tier performers accomplish this feat not necessarily by being larger or older, but by operating with significantly lower customer acquisition costs, tighter capital consumption ratios, and a stronger inclination toward vertical market specialization rather than generalized enterprise plays.
Broader Implications and Strategic Takeaways
The release of Part 2 of the 2018 SaaS survey provides executive leadership teams, founders, and venture capital investors with an empirical compass for navigating operational scaling. The findings challenge several legacy assumptions—particularly regarding gross churn calculations and capital consumption efficiency—while reinforcing the paramount importance of net revenue retention, efficient cloud infrastructure utilization, and disciplined sales compensation alignment.
As the B2B software market continues to mature, private companies operating below the public market’s benchmark standards face mounting pressure to optimize their cost structures, improve gross margins, and balance hyper-growth aspirations with sustainable capital efficiency. Ultimately, the insights compiled by KBCM Technology Group and industry researchers offer an invaluable roadmap for building resilient, scalable, and enduring software enterprises in an increasingly competitive global economy.