Unlocking Private SaaS Growth Metrics: KBCM Technology Group and forEntrepreneurs Release Comprehensive 2019 Survey Findings


For the seventh consecutive year, industry leaders forEntrepreneurs and KBCM Technology Group—formerly recognized as Pacific Crest Securities—have pooled their extensive resources to publish an exhaustive benchmarking report detailing the operational and financial performance of private Software-as-a-Service (SaaS) companies. Drawing data directly from approximately 424 private SaaS enterprises, this year’s installment provides a granular look at the metrics defining modern cloud-based businesses, offering critical insights into organic Annual Recurring Revenue (ARR) growth, customer acquisition costs (CAC), sales and marketing efficiencies, and application delivery models.
As the subscription economy matures, the demand for transparent, data-driven benchmarks has never been more urgent. Founders, venture capitalists, and executive leadership teams continually navigate the precarious balance between aggressive scaling and sustainable capital consumption. By aggregating empirical data from hundreds of contributors—facilitated by platform readers and curated by figures like David Spitz and the analytics team at KBCM—this report serves as an indispensable compass for private companies aiming to transition from promising startups to resilient, enterprise-grade organizations.
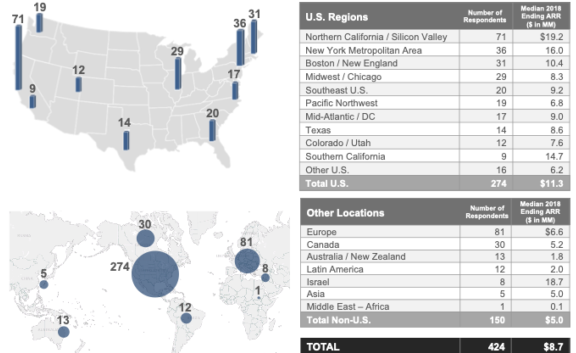
Participant Demographics and Survey Methodology
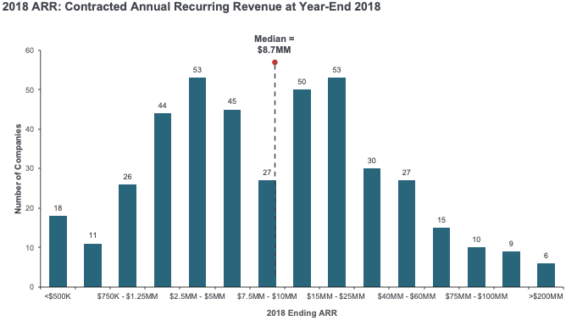
The 2019 survey captured a diverse cross-section of the global private SaaS ecosystem, predominantly anchored in North America but reflecting varied geographic footprints and company lifecycles. To ensure analytical integrity, the participant pool was segmented across multiple dimensions, notably by total ARR size distribution. The dataset encompassed micro-ventures generating under $2.5 million in ARR up to mature market leaders scaling past $100 million.
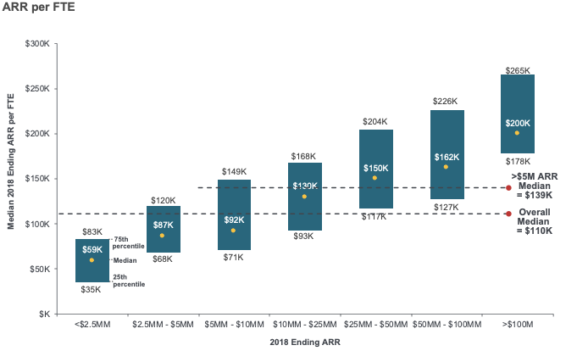
Human capital efficiency emerged as a foundational metric across these tiers, measured through ARR per Full-Time Equivalent (FTE). Across 422 responding companies, human capital output scaled predictably with organizational size, highlighting how operational leverage improves as administrative and technical overhead becomes more distributed. Geographically, the concentration of respondents underscored major tech hubs while also capturing a robust distributed contingent of remote-first and regional SaaS providers.
Organic ARR Growth Trends and the Growth-Burn Tradeoff
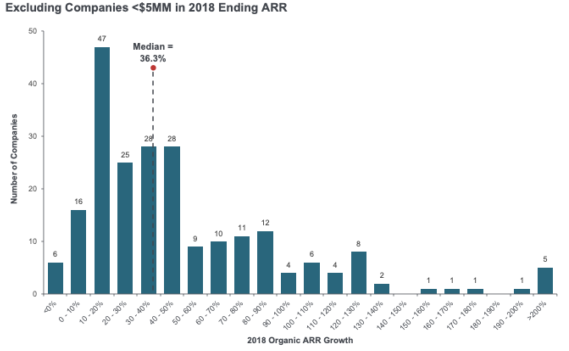
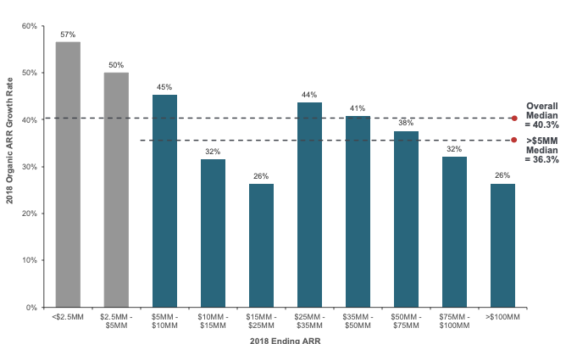
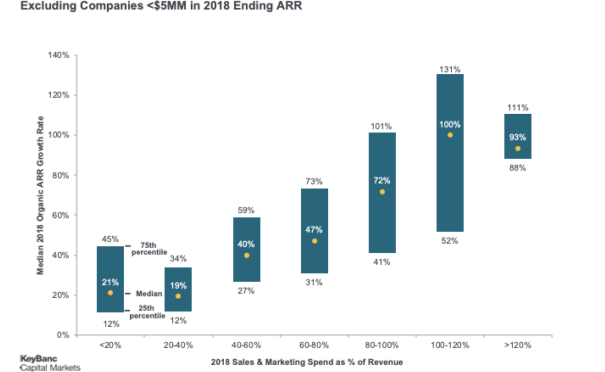
Organic ARR growth—intentionally isolated from the distorting effects of mergers and acquisitions—remains the premier litmus test for SaaS vitality. Based on data from over 300 respondents, median growth rates demonstrated how momentum shifts as businesses scale. Companies in the sub-$2.5 million ARR bracket often reported hyper-growth percentages, albeit off a smaller baseline, whereas organizations surpassing the $50 million and $100 million thresholds experienced a natural compression in percentage growth, though absolute dollar additions scaled massively.
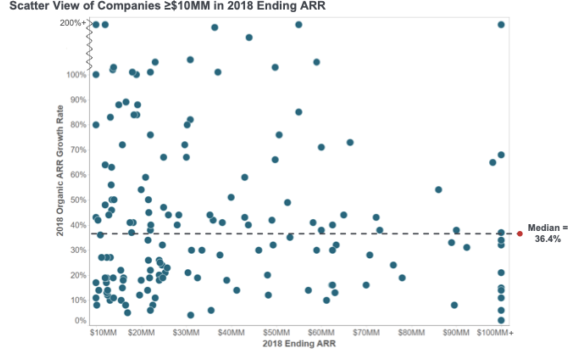
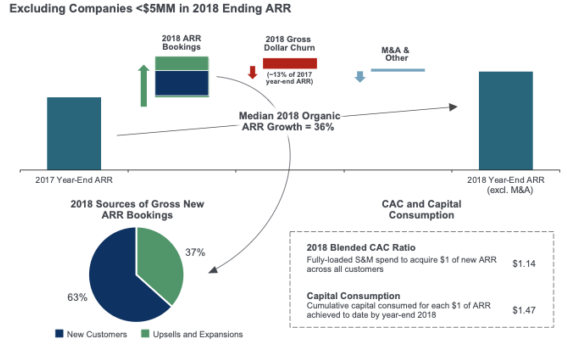
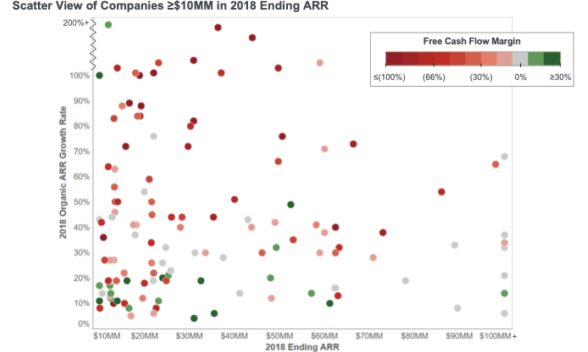
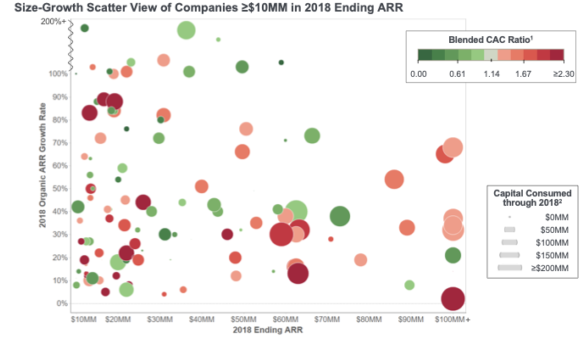
A central narrative of the report is the perpetual tension between rapid expansion and capital burn. The survey’s growth-versus-burn analysis mapped how aggressively companies spent to acquire new revenue relative to their capital consumption ratios. In-year and cumulative capital consumption metrics revealed that while institutional investors frequently reward top-line acceleration above all else, capital efficiency has re-emerged as a vital metric. Companies balancing high organic ARR growth with disciplined cash management positioned themselves more favorably for subsequent funding rounds or eventual public market readiness.
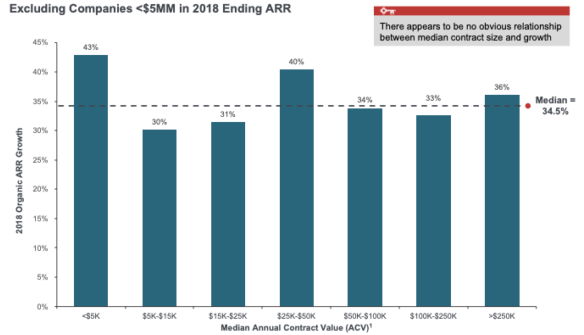
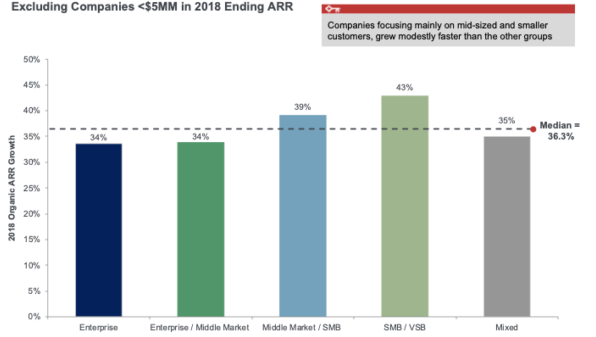
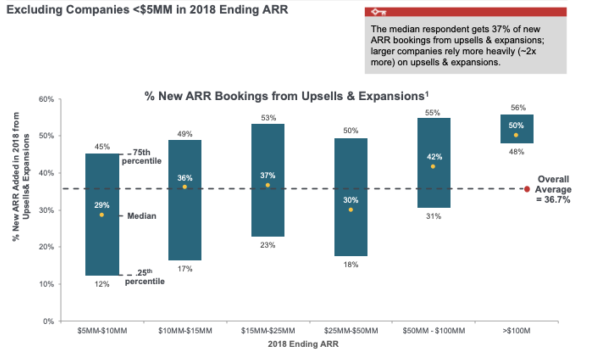
Furthermore, the data scrutinized median growth as a function of Annual Contract Value (ACV) and target customer focus. Enterprises targeting large corporations (>1,000 employees) exhibited different growth trajectories and sales cycles compared to those focusing on Small and Medium Businesses (SMBs) or Very Small Businesses (VSBs). Companies relying heavily on upsells and expansions from existing customers demonstrated superior net revenue retention, highlighting that land-and-expand motions are often more capital-efficient than pure new-customer acquisition.
Go-To-Market Strategies: Field Sales vs. Inside Sales
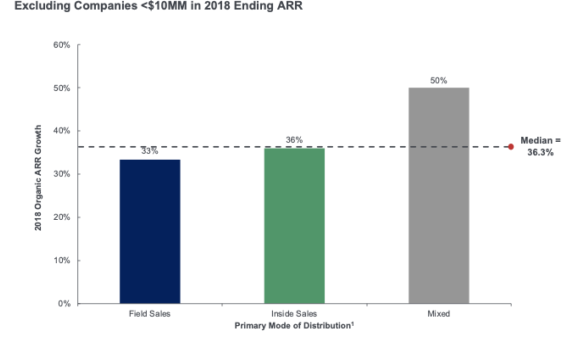
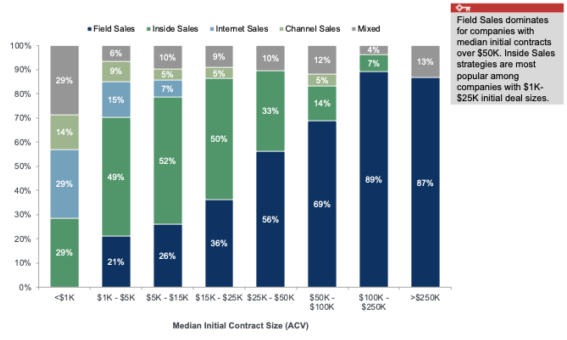
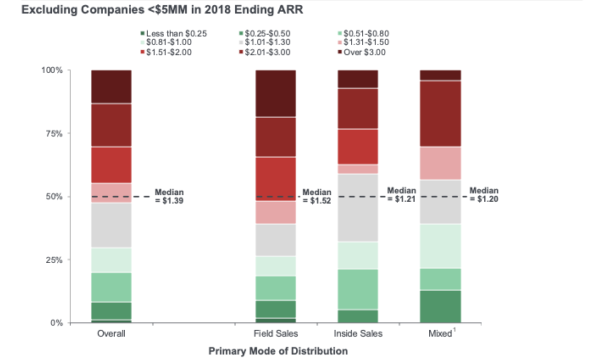
Go-to-market (GTM) execution remains one of the most significant cost drivers for any SaaS enterprise. The report provides a deep dive into primary modes of distribution, contrasting field sales against inside sales strategies across key deal-size crossover tiers.
Field sales dominated among companies with larger contract sizes and enterprise-focused motions, commanding higher median ARR figures (such as $22 million for field-dominated models compared to $15 million for inside-sales-dominated structures). Conversely, inside sales proved to be the engine for mid-market and SMB acquisition, offering shorter sales cycles and lower fully-loaded customer acquisition costs.

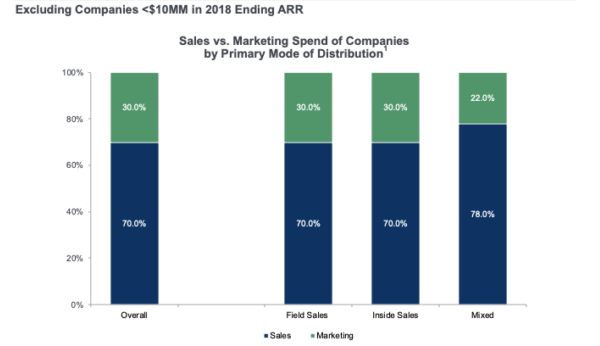
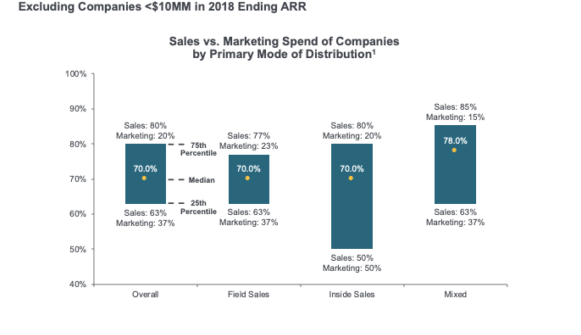
The analysis extended into sales and marketing (S&M) composition, dissecting the exact ratio of sales headcount costs versus marketing expenditures. By evaluating respondents falling above the 75th percentile and below the 25th percentile in S&M spending efficiency, the report illustrated how misaligned compensation structures or bloated marketing funnels can severely degrade a company’s rule-of-40 score.
Deconstructing CAC Ratios and Payback Periods
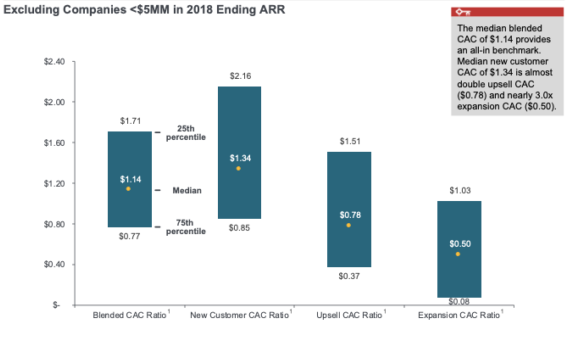
Customer Acquisition Cost (CAC) continues to be scrutinized by executive boards seeking to optimize unit economics. The survey established rigorous definitions for CAC ratios, breaking them down into blended CAC, new customer CAC, upsell CAC, and expansion CAC.
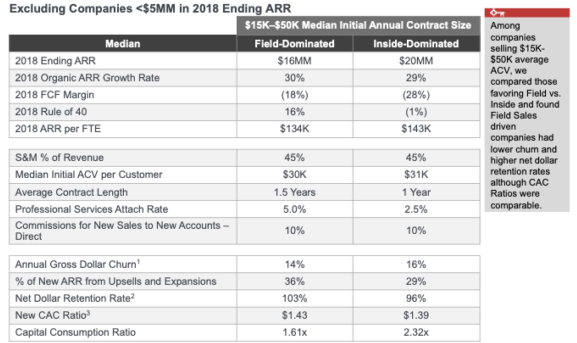
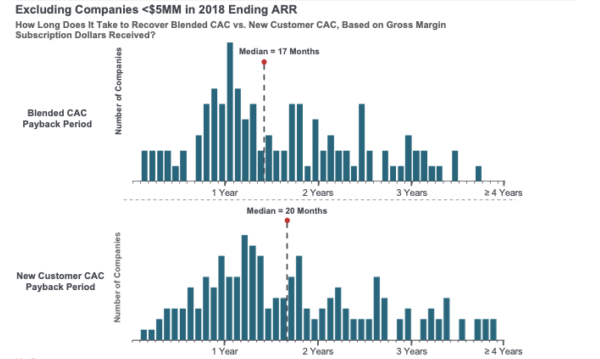
A critical finding within the report is the distribution of 2018 CAC ratios and their direct translation into implied CAC payback periods on a gross margin basis. Calculated by dividing the CAC ratio by subscription gross margin, the payback period indicates the exact number of months of subscription gross profit required to recover the fully-loaded cost of acquiring a customer.
The data revealed a wide dispersion in payback periods across the industry. Highly efficient SaaS firms achieved payback windows under 12 months, driven by strong inbound demand, low churn, and efficient inside sales motions. In contrast, complex enterprise sales requiring extensive field deployment often faced extended payback periods, necessitating high net-dollar retention rates over multi-year contract lifecycles to justify the initial capital outlay.

Operational Excellence: Gross Margins and Delivery Infrastructure
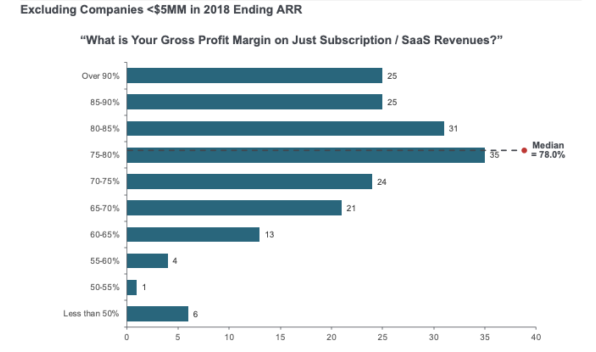
On the operational front, subscription gross margins remained exceptionally robust across the surveyed cohort, with a median hovering comfortably in the high-70s to low-80s percentage range. Respondents were instructed to back out stock-based compensation expenses and properly account for customer support costs to ensure apples-to-apples comparisons.
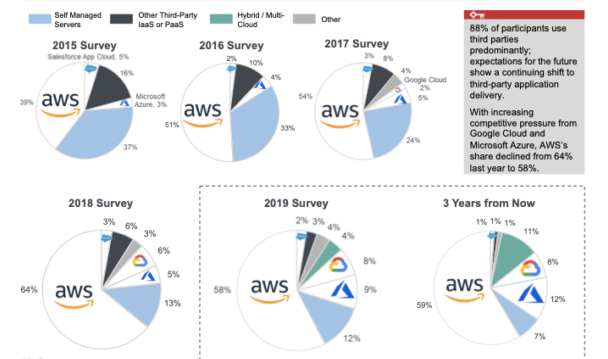
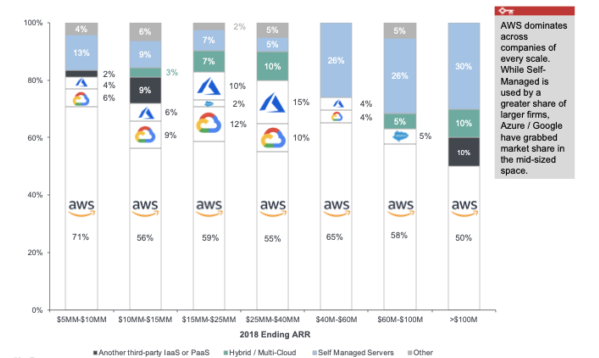
Application delivery trends highlighted a decisive, ongoing migration toward public cloud infrastructure. Tracking data from 2014 through projected figures three years out, Amazon Web Services (AWS) maintained its dominance as the predominant hosting environment, followed by Microsoft Azure and Google Cloud, while self-managed servers continued their secular decline. Subscription gross margins varied slightly depending on the underlying cloud architecture and whether companies utilized hybrid or multi-cloud configurations.

Additionally, the report examined professional services as a percentage of first-year ARR, noting that enterprise-heavy SaaS providers frequently bundle implementation and custom deployment services. While professional services can accelerate time-to-value for enterprise clients, they often carry lower gross margins than pure software subscriptions, requiring careful management to prevent margin dilution.
Sales Compensation, Commissions, and Incentives
Sales compensation structures dictate sales force motivation and directly impact unit economics. The survey’s deep dive into sales commission levels—categorized by primary distribution mode and initial median contract size—revealed industry standards for quota-carrying representatives.
Commissions scaled dynamically based on deal size and complexity. For multi-year deals, renewals, and upsells, companies reported varying commission incentives designed to encourage long-term customer retention rather than short-sighted land grabs. Direct commissions for renewals and upsells are increasingly utilized by mature SaaS firms to align sales and customer success teams toward curbing churn.
Implications and Broader Industry Outlook
The release of the 2019 KBCM Technology Group and forEntrepreneurs SaaS survey arrives at a pivotal juncture for the tech sector. As macroeconomic conditions fluctuate and investor sentiment evolves, the empirical benchmarks established in this report provide an objective reality check for private company operators.
The clear takeaway for startup founders and financial officers is that growth at all costs is increasingly being superseded by disciplined capital efficiency. Companies that master the delicate equilibrium between organic ARR growth, optimized S&M spend, manageable CAC payback periods, and high net revenue retention will be best positioned to weather market volatility and secure premium valuations.
Industry stakeholders are encouraged to download the full, unabridged report directly through KBCM Technology Group’s official corporate resources portal to access complete data tables, methodological notes, and advanced segmentation analyses.