Maximizing Business Efficiency: A Comprehensive Guide to Utilizing KPI Dashboards for Project and Operational Success

Key Performance Indicators (KPIs) have long served as the navigational compass for modern enterprises, providing quantifiable metrics to track progress, evaluate operational efficiency, and ensure strategic alignment. In an increasingly data-driven global economy, the ability to rapidly collect, analyze, and visualize performance metrics can mean the difference between market leadership and organizational obsolescence. As businesses navigate complex project lifecycles and shifting market demands, the deployment of structured KPI dashboards has transitioned from a competitive advantage to a fundamental operational necessity.
Understanding the Mechanics of Key Performance Indicators
At its core, a KPI is a measurable value that demonstrates how effectively a company is achieving key business objectives. Organizations use KPIs at multiple levels to evaluate their success at reaching targets. High-level KPIs may focus on the overall performance of the business, while low-level KPIs may focus on processes in departments such as sales, marketing, human resources, or project management.
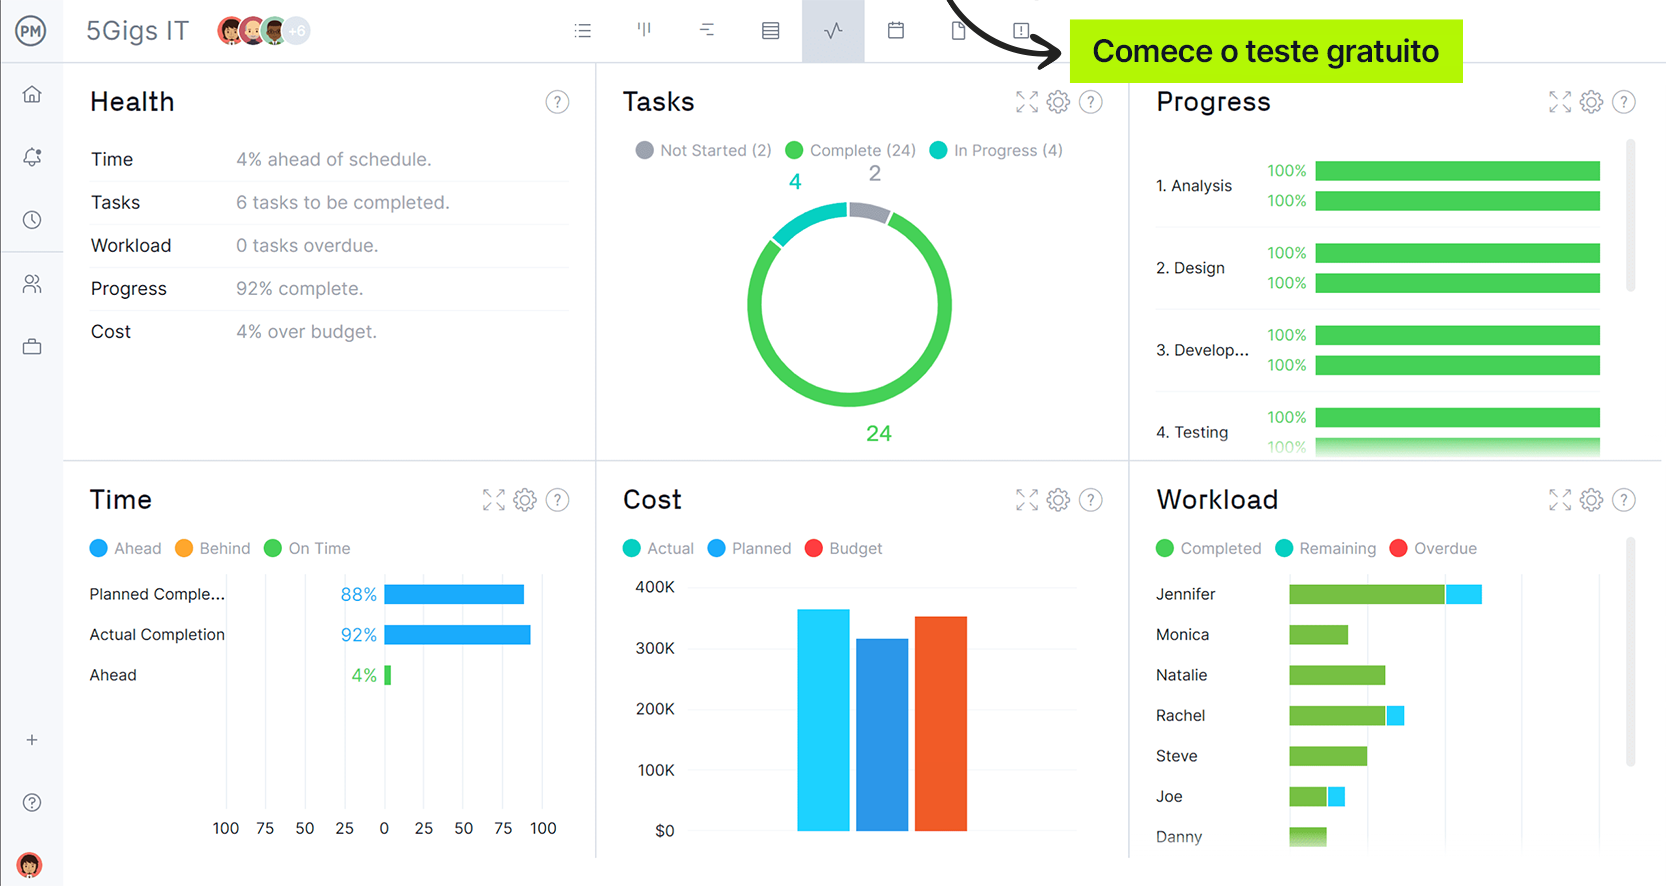
A KPI dashboard consolidates these disparate metrics into a centralized visual interface. By transforming raw numerical data into interactive charts, graphs, and heat maps, these dashboards allow stakeholders to monitor health metrics in real time. Historical evolution in business intelligence shows that organizations relying solely on static, manual reports often experience a significant delay between operational events and strategic decision-making. Consequently, modern organizational frameworks emphasize visual tools that reduce cognitive load, highlight emerging bottlenecks, and foster cross-departmental transparency.
The Strategic Evolution of Performance Tracking
The historical trajectory of corporate performance management has shifted dramatically over the past three decades. During the late 20th century, performance tracking was predominantly retrospective, relying on quarterly financial statements and end-of-year reviews. This lagging methodology restricted management to reactive problem-solving rather than proactive strategy execution.
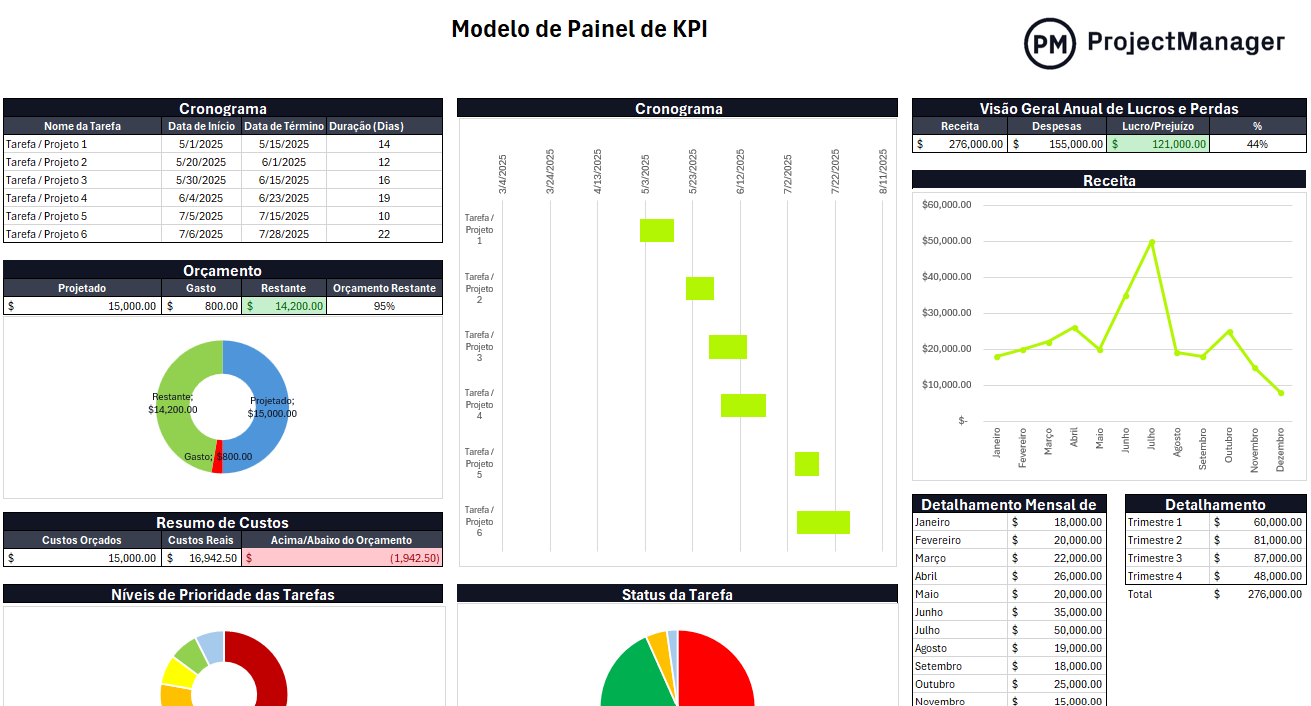
As personal computing and spreadsheet software advanced in the 1990s and 2000s, businesses began developing internal ledger-based tracking systems. While these tools offered greater flexibility than paper records, they remained siloed and labor-intensive. The introduction of structured spreadsheet templates standardized how organizations tracked timelines and budgets. However, these static models still lacked the dynamism required for fast-paced corporate environments.
By the 2010s, cloud computing and automated software platforms revolutionized performance monitoring by introducing live data feeds and automated reporting. Today, contemporary organizations utilize sophisticated software solutions that bridge the gap between static spreadsheet templates and real-time enterprise resource planning. This evolution underscores a critical industry consensus: timely data access directly correlates with risk mitigation and resource optimization.
Core Applications: Project Management and Operational Control
The utility of a KPI dashboard spans two primary operational domains: project management and general corporate administration. Each domain utilizes specific metrics to drive accountability and measure long-term viability.
In project management, dashboards serve as dynamic command centers. Project managers leverage visual metrics to oversee critical paths, allocate human capital, monitor expenditures, and maintain stringent quality controls. By establishing baseline schedules and comparing actual progress against projected timelines, teams can identify deviations early in the project lifecycle. This early detection mechanism minimizes scope creep, prevents budget overruns, and ensures deliverables align with stakeholder expectations.
In broader operational management, organizations rely on KPIs to track foundational growth pillars such as customer acquisition costs, monthly sales velocity, lead conversion ratios, and employee utilization rates. According to industry analysts specializing in corporate efficiency, companies that systematically review operational dashboards exhibit higher profit margins and lower employee turnover rates compared to those relying on ad-hoc evaluations. By aligning day-to-day tasks with overarching strategic goals, operational leaders can eliminate redundancies and optimize supply chain logistics.
Anatomy of an Effective Performance Dashboard
Designing an optimal KPI tracking mechanism requires a meticulous selection of metrics tailored to specific organizational goals. Industry standards suggest that a comprehensive tracking template should incorporate several foundational components:
Chronological Scheduling and Milestones
Tracking time remains paramount in any business endeavor. Establishing clear temporal boundaries for task completion allows teams to map out short-term sprints alongside long-term strategic initiatives. Whether managing a localized marketing campaign or an enterprise-wide software rollout, visual timelines prevent missed deadlines.
Budgetary and Financial Oversight
Financial transparency ensures that expenditures do not outpace revenue generation. Dashboards must capture capital allocation, operational costs, labor expenses, and projected profit margins on a monthly, quarterly, and annual basis. Real-time cost tracking guards against unexpected fiscal deficits.
Resource Allocation and Workforce Capacity
Human capital represents one of the largest investments for any organization. Monitoring employee hours, active workloads, remaining availability, and labor costs ensures that teams operate at optimal capacity without facing burnout. Balanced resource distribution directly improves workplace morale and project output quality.
Material and Non-Human Asset Utilization
Beyond labor, organizations must account for physical inventory, machinery, equipment depreciation, and software subscriptions. Comprehensive tracking models itemize these non-human resources to prevent waste and maintain accurate asset valuation.
Priority Matrix Integration
Categorizing tasks by urgency—ranging from critical to low priority—enables teams to triage operational roadblocks effectively. Color-coded visual indicators draw immediate attention to high-impact issues, allowing leadership to reallocate resources swiftly.
The Limitations of Static Models Versus Dynamic Solutions
While downloadable spreadsheet templates offer an accessible entry point for small businesses and startups, industry experts note inherent limitations in static tools. Traditional templates require manual data entry, creating vulnerabilities to human error and introducing latency into the reporting cycle. When data is updated infrequently, decision-makers are forced to act on historical rather than current information.
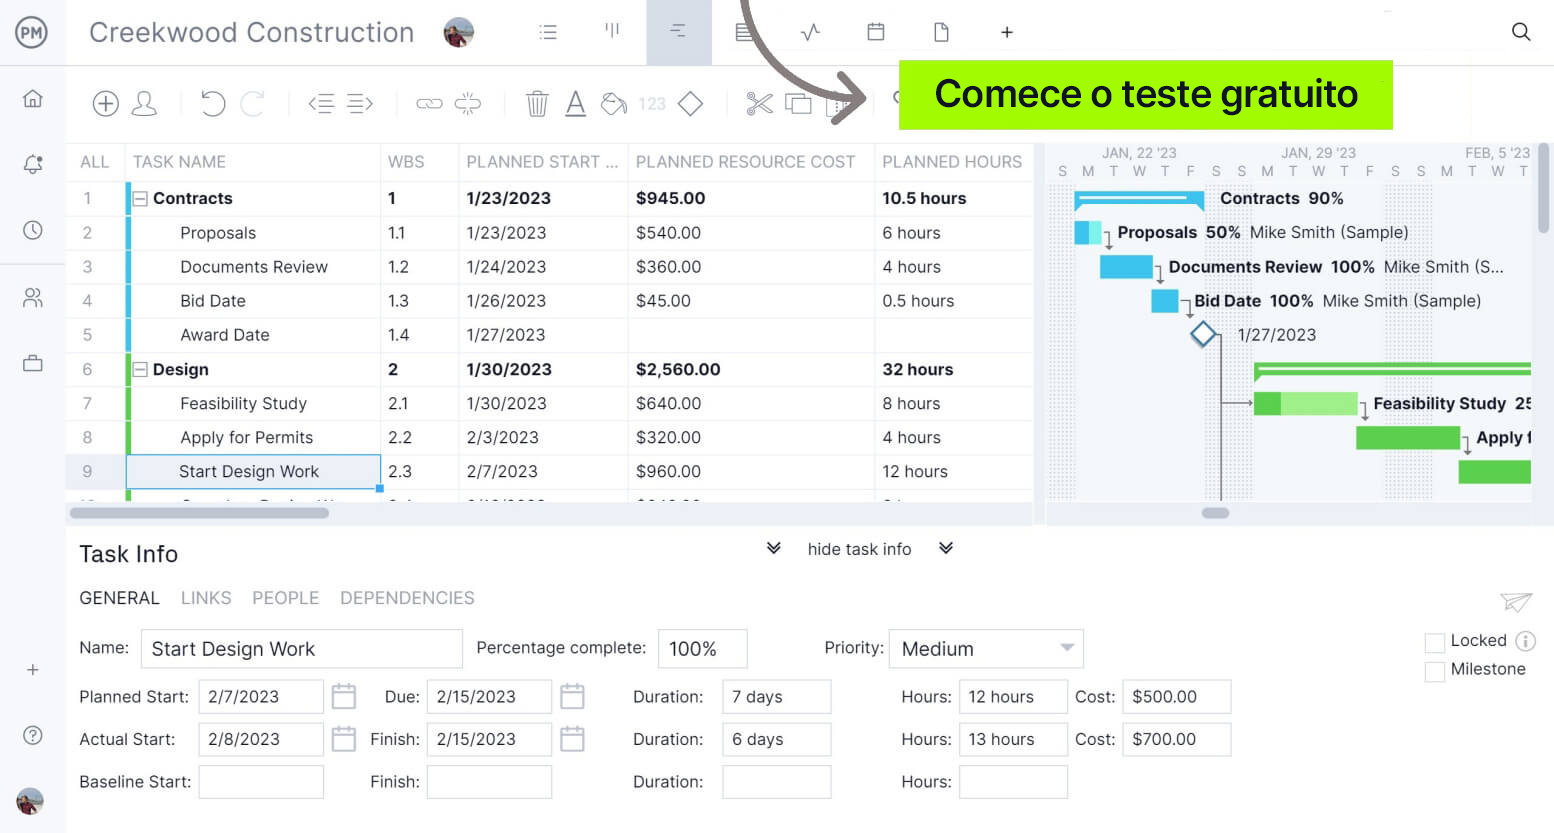
To overcome these structural constraints, many mid-sized to enterprise-level organizations transition to dedicated project management software. Modern software platforms automate data collection, integrate cross-platform metrics into centralized cloud repositories, and generate customized reports instantaneously.
Industry analysts observe that automated tracking ecosystems reduce administrative overhead by up to 30%, freeing management personnel to focus on strategic execution and client engagement. Furthermore, advanced software solutions incorporate robust permission settings and mobile accessibility, enabling remote and hybrid teams to collaborate seamlessly across geographical boundaries.
Broader Implications and Future Outlook
The continuous refinement of performance analytics holds profound implications for the global business landscape. As artificial intelligence and machine learning algorithms become deeply embedded in enterprise software, KPI dashboards are shifting from descriptive tools—which explain past performance—to predictive and prescriptive instruments that forecast future trends and recommend strategic interventions.
Organizations that embrace these advanced analytical frameworks position themselves to adapt swiftly to macroeconomic fluctuations, regulatory changes, and evolving consumer preferences. Conversely, firms that cling to outdated, manual tracking methods risk operational stagnation.
Ultimately, the deployment of a structured KPI dashboard—whether executed through foundational templates or advanced cloud software—serves a singular, vital purpose: establishing total organizational clarity. By democratizing access to performance data and fostering a culture of accountability, businesses can navigate uncertainty with confidence, ensuring sustainable growth and long-term competitive resilience in a complex global marketplace.