The digital landscape has long grappled with how to effectively communicate abstract macroeconomic concepts to the general public. Traditional media relies heavily on static infographics, dense economic reports, and pie charts that often fail to capture the sheer magnitude of modern financial disparities. Addressing this challenge head-on, Stack Overflow co-founder Jeff Atwood, alongside longtime collaborator and fellow software engineer Geoff Dalgas, has launched a new interactive digital project entitled DreamAgainUSA. Designed not as a traditional video game or a passive article, but as an endurance-based digital experience, the platform aims to force users to physically and mentally confront the stark realities of wealth distribution in the United States through an exhaustive, linear scroll.
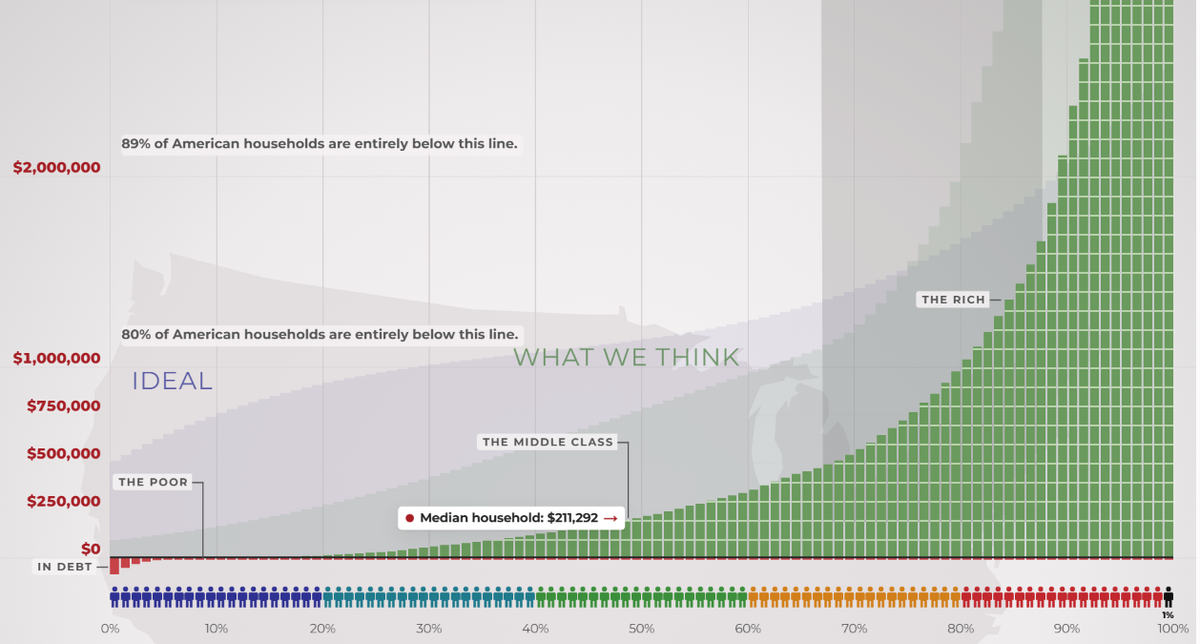
At its core, DreamAgainUSA utilizes a linear visual scale to map out the vast chasm separating the country’s poorest citizens from its wealthiest billionaires. Unlike logarithmic charts that compress extreme values to fit neatly onto a single computer monitor, the site’s architecture maintains a strict, proportional scale. This design choice transforms the act of viewing data into a grueling physical task. Users are required to scroll continuously upward from the bottom of the graph—representing the financial reality of minimum wage workers and individuals living below the poverty line—toward the staggering apex occupied by the ultra-wealthy.
The Genesis and Technical Architecture of DreamAgainUSA

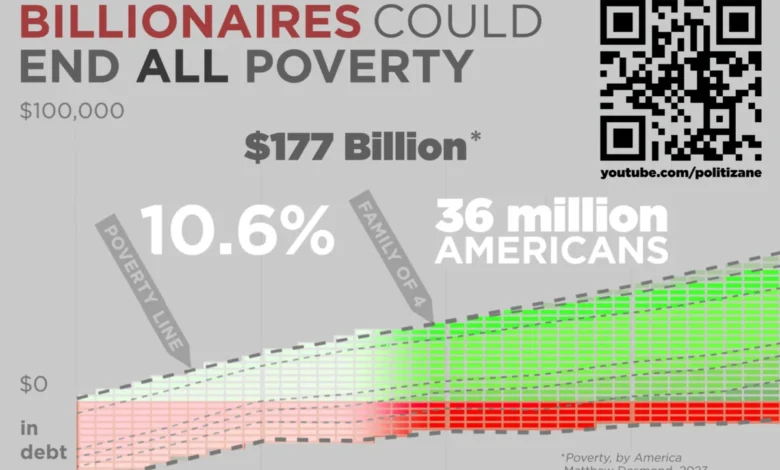
The conceptual framework behind DreamAgainUSA draws inspiration from classic multimedia presentations on economic inequality, most notably the viral 2012 video series by Politizane. Atwood has frequently cited that original project as a pivotal moment that fundamentally shifted his worldview regarding systemic wealth concentration. Fourteen years later, Atwood partnered with creators behind the updated 2026 wealth inequality video series, as well as independent editorial outlets like The Onion and Garbage Day, to build a public-facing digital monument to economic disparity.
Geoff Dalgas, recognized in the tech community as the third employee and foundational engineer behind Stack Overflow alongside Atwood, engineered the site’s unique technical infrastructure. During development, Dalgas and Atwood experimented with various automated scrolling mechanisms and rapid-jump features. However, they deliberately rejected these conveniences in favor of forced physical interaction.
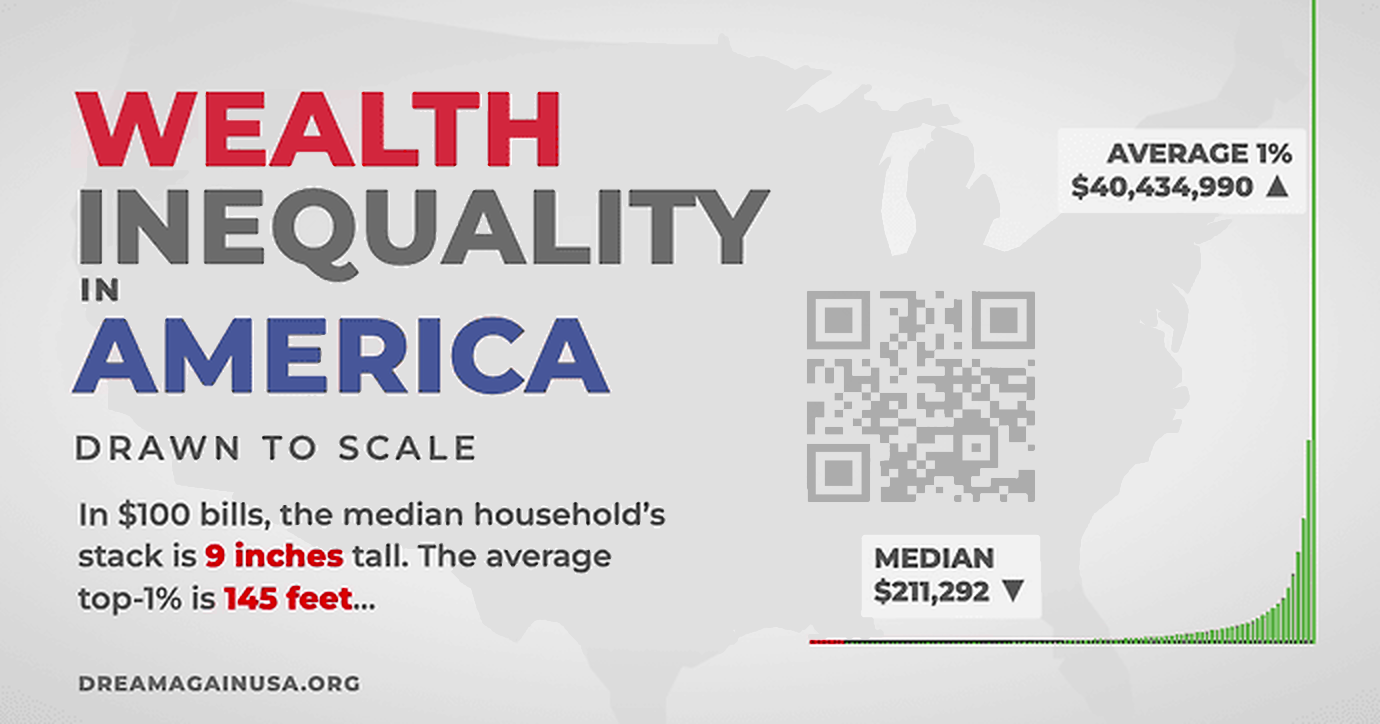
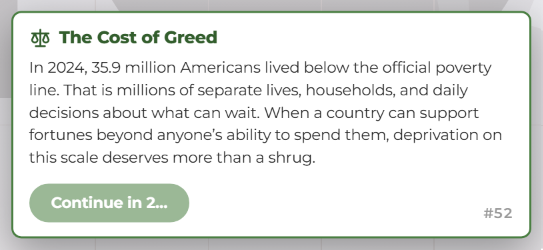
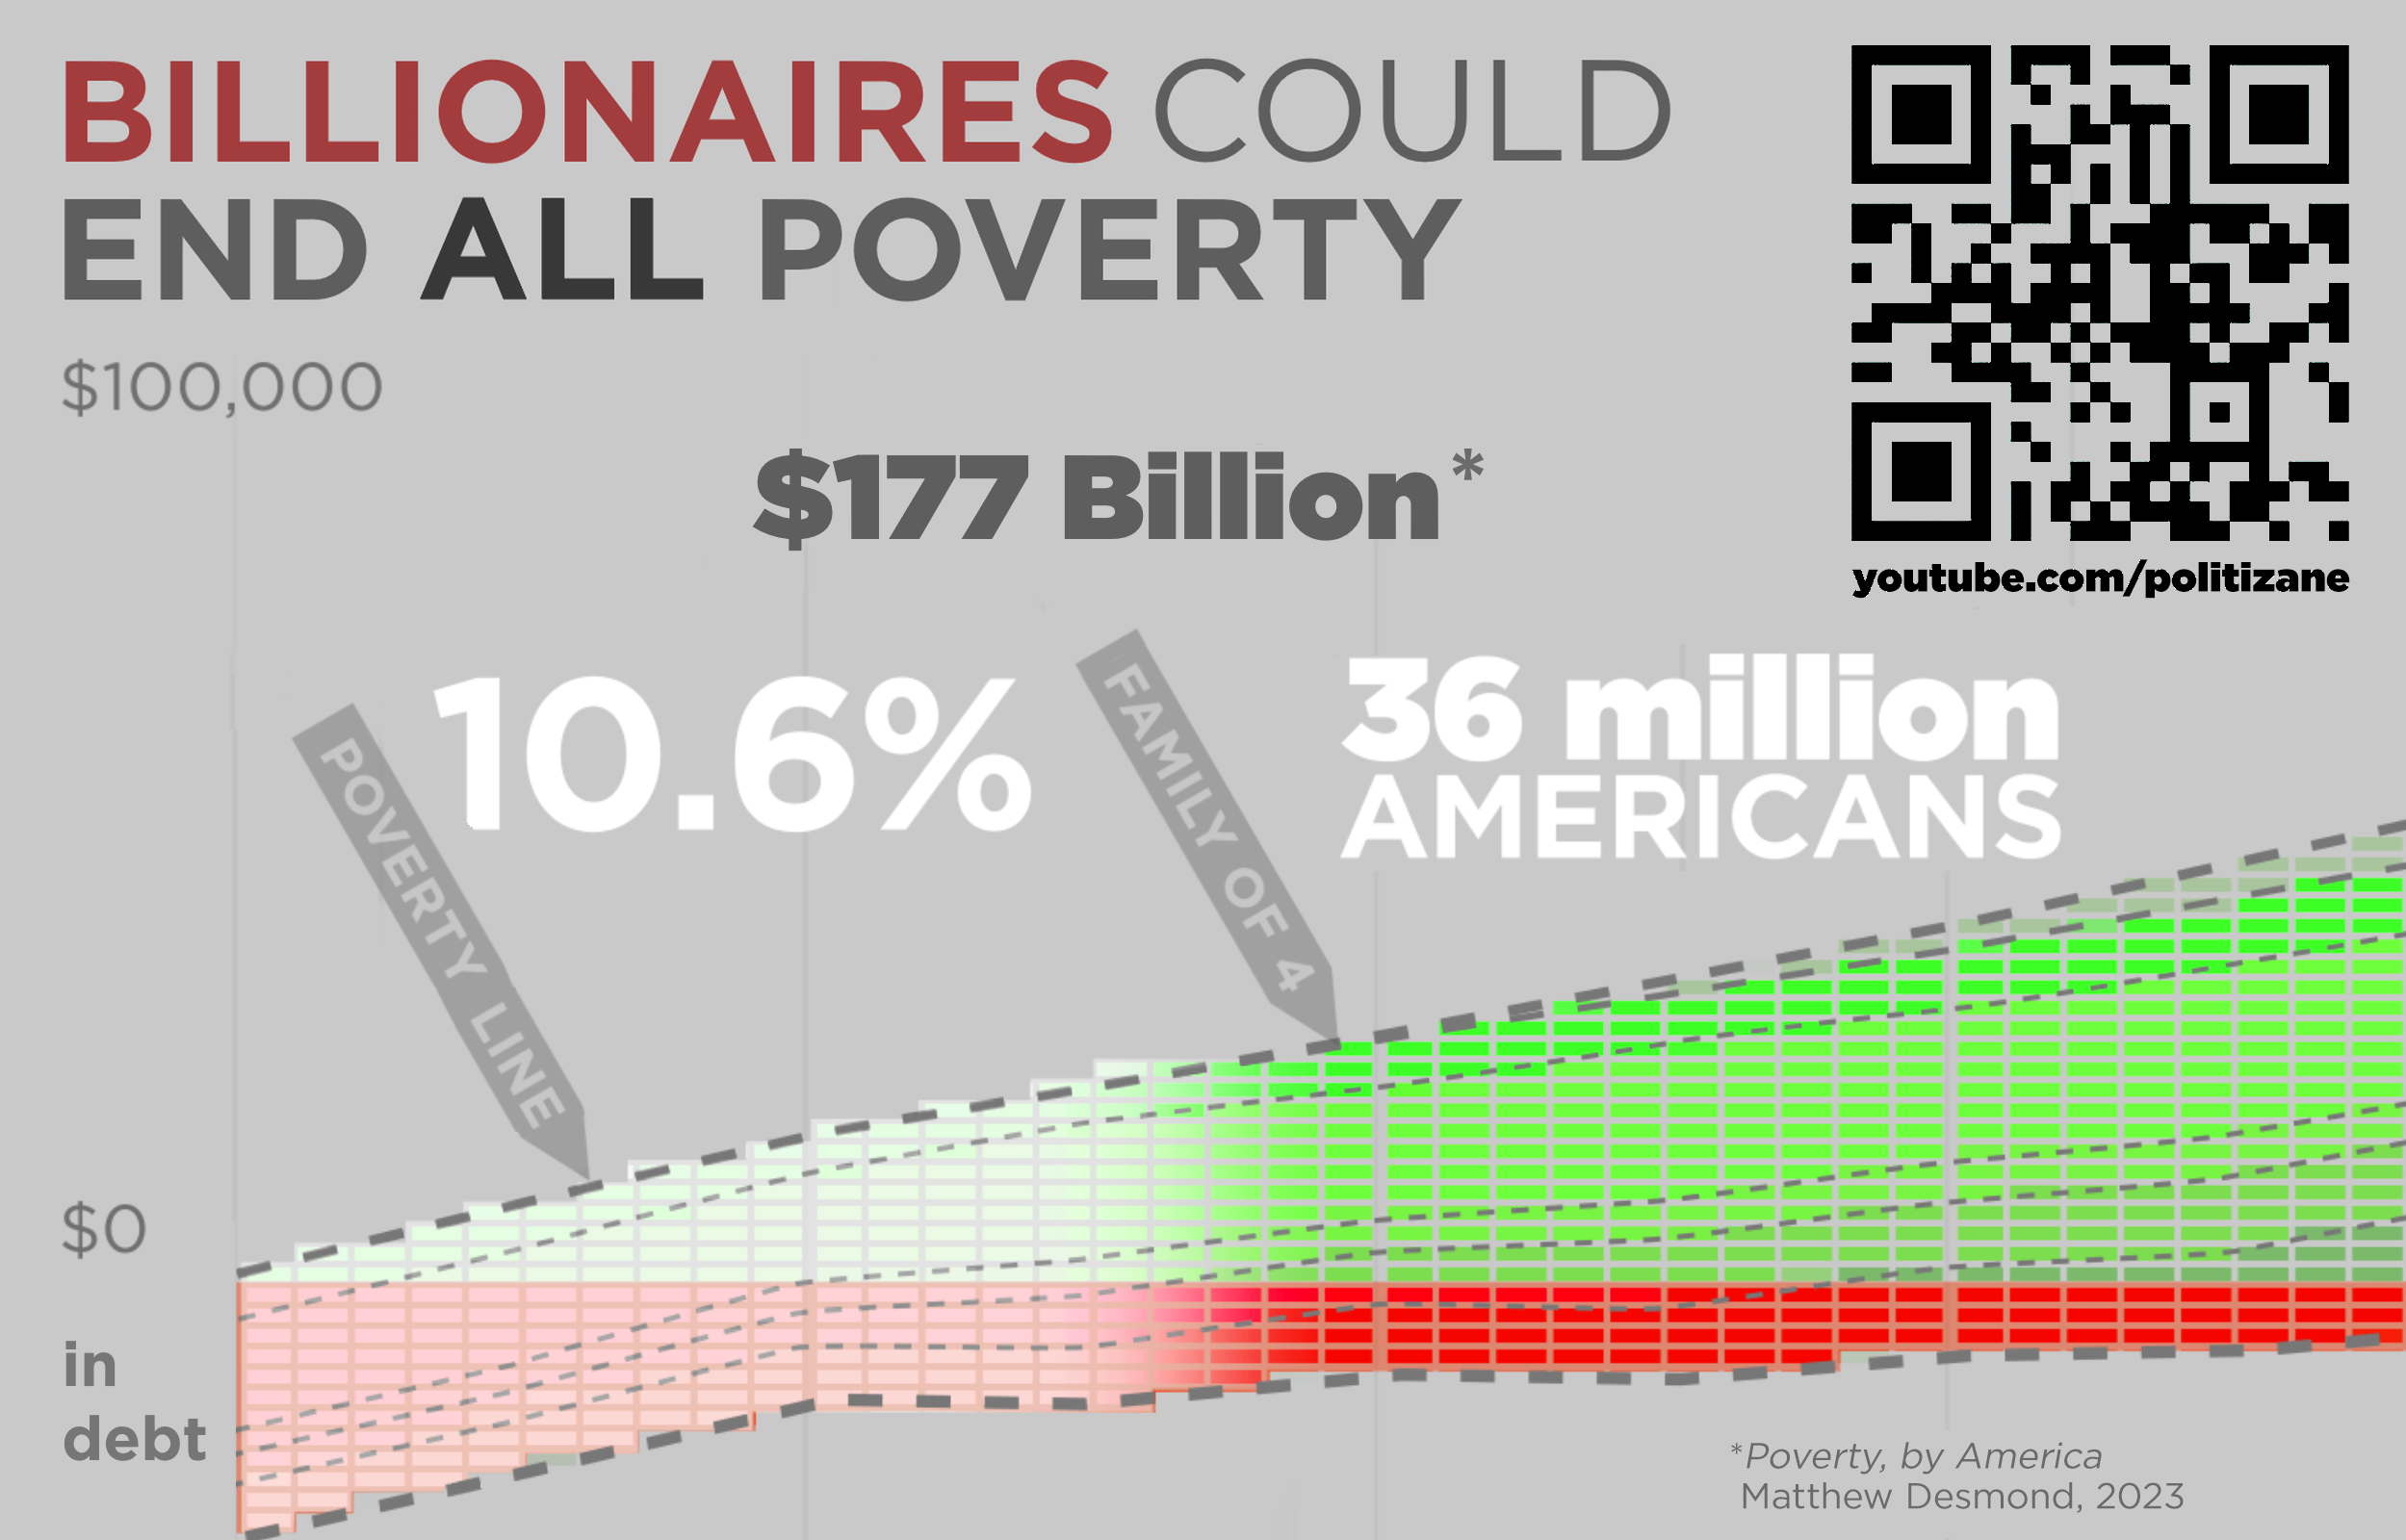
According to Atwood, the deliberate friction engineered into the user experience is intentional. Early testing revealed that users needed to experience a fraction of the exhaustion inherent to financial survival to truly internalize the data. Consequently, the website intentionally arrests the user’s progress at critical sociological milestones. For instance, the scrolling mechanism halts entirely when reaching the threshold representing the tens of millions of Americans currently living in poverty. This mandatory pause forces the audience to confront specific policy-relevant calculations, such as the estimated capital required to eradicate poverty domestically, juxtaposed against the localized accumulation of extreme fortunes.
Quantifying the Disparity: Data and Methodology
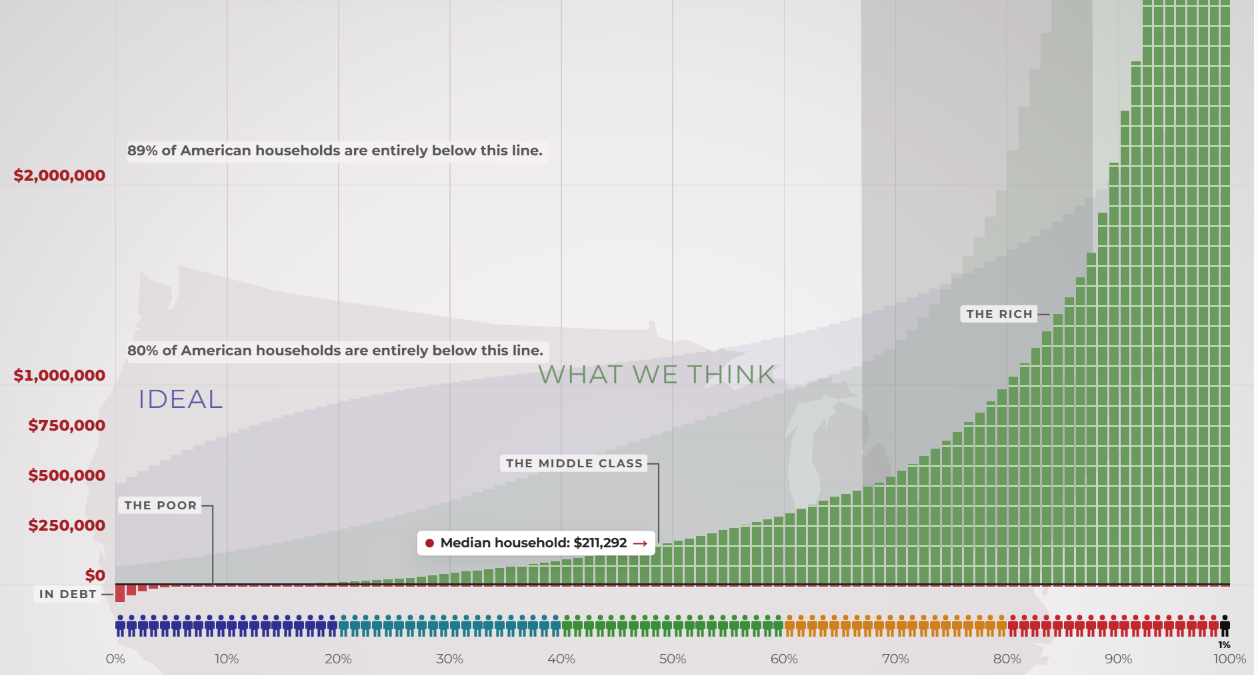
The quantitative backbone of DreamAgainUSA relies on publicly available economic datasets, government labor statistics, and wealth distribution studies. By adhering strictly to a linear scale, the platform exposes a visualization problem that standard infographic design often conceals. To print the entirety of the DreamAgainUSA graph on standard 8.5-by-11-inch office paper at scale would require tens of thousands of pages, underscoring the impossibility of capturing extreme wealth concentration through conventional, compressed charting methods.
To bridge the gap between digital interaction and physical comprehension, the platform provides a downloadable, eight-page foldable version of the graph. Designed to stretch six feet and six inches—matching the average height of a professional basketball player—this physical artifact serves as a tangible metric for offline education and public discourse.

At the baseline of this economic spectrum sits the federal minimum wage. Calculated across a standard forty-hour workweek for all fifty-two weeks of the year, a minimum wage worker earns approximately $15,080 annually before taxes. Within this fixed numerical boundary, recipients must reconcile skyrocketing costs for essential urban or rural infrastructure, including housing rent, groceries, transportation, and healthcare. Economists and public health researchers frequently point out that navigating these combined expenses leaves virtually no margin for emergency savings, generational wealth accumulation, or upward social mobility.
Conversely, the upper echelons of the graph represent accumulated net worths that exceed the gross domestic product of multiple sovereign nations. Economic analysts note that the concentration of capital at the absolute top of the American economy has reached historical highs not seen since the Gilded Age. Public policy watchdogs emphasize that while charitable giving and philanthropic foundations absorb a portion of these assets, the foundational mechanics of wage stagnation and capital gains taxation continue to widen the median household wealth gap.

Implications and Public Reception
The launch of DreamAgainUSA has reignited broader national debates regarding economic mobility, corporate responsibility, and the ethics of extreme wealth accumulation. By framing software usability principles around intentional discomfort, Atwood and Dalgas have inverted decades of user experience (UX) design philosophy. Typically, software engineering strives to minimize friction, reduce load times, and streamline user journeys. By intentionally introducing exhaustion and psychological friction into DreamAgainUSA, the creators argue that the software accurately mirrors the relentless, exhausting endurance required to navigate systemic poverty.
Critics of extreme wealth inequality argue that visualizations like DreamAgainUSA provide essential civic literacy, helping voters connect macroeconomic statistics to human outcomes. Proponents of free-market capitalism, however, often contend that aggregate wealth creation drives technological innovation and economic expansion, asserting that focus should remain on overall GDP growth rather than wealth redistribution metrics.
Despite differing perspectives on economic policy, media analysts have praised the project for its transparency and refusal to monetize public outrage. Atwood has maintained that the platform operates entirely independently of corporate sponsorships or personal branding agendas, functioning instead as a public utility dedicated to civic education.
As users continue to test the limits of their digital endurance by scaling the DreamAgainUSA interface, the project leaves its audience with a lingering existential query. For those who invest the necessary time and physical effort to reach the apex of the linear graph, the platform concludes with a straightforward prompt: Was it worth it? Through this inquiry, DreamAgainUSA successfully transcends traditional data visualization, challenging contemporary society to reevaluate the structural integrity of its economic foundations.
Related posts: