Unveiling the 2018 Private SaaS Company Survey Results: Growth, Go-To-Market Strategies, and Capital Efficiency Benchmarks


For the seventh consecutive year, industry leaders and entrepreneurs have gained access to one of the most comprehensive analytical benchmarks in the tech sector, courtesy of a collaborative research effort between KBCM Technology Group (formerly Pacific Crest Securities) and the digital publication forEntrepreneurs. The latest iteration of the survey captures critical financial and operational metrics from approximately 424 private Software-as-a-Service (SaaS) companies. This extensive dataset serves as an invaluable resource for founders, venture capitalists, and executive management teams looking to contextualize their organization’s performance against industry medians, market trends, and capital efficiency standards.
Background Context and Survey Methodology
The annual SaaS survey has long established itself as the gold standard for private cloud computing companies seeking empirical data on operational metrics, sales and marketing efficiency, and growth trajectories. In an ecosystem where capital allocation and customer acquisition costs (CAC) dictate long-term viability, granular insights derived from hundreds of active market participants provide necessary clarity.
David Spitz and the dedicated research team at KBCM Technology Group, in partnership with forEntrepreneurs, spearheaded the exhaustive data collection process. The resulting publication—officially designated as Part One of the comprehensive report—sheds light on organic Annual Recurring Revenue (ARR) growth, sales commission structures, customer acquisition metrics, human capital efficiency, and application delivery trends. By capturing responses from more than 400 private firms globally, the survey reflects a highly representative cross-section of the modern B2B SaaS landscape, spanning early-stage ventures to mature enterprises generating over $100 million in annual recurring revenue.
Participant Composition and Demographic Distribution
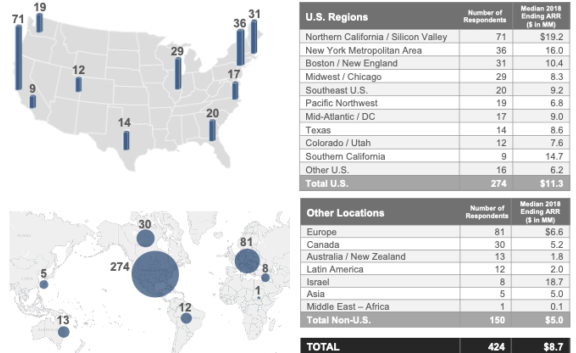
Understanding the structural makeup of the survey respondents is vital for interpreting the aggregated median metrics. The geographic distribution of the participant pool is heavily skewed toward North America, mirroring the broader concentration of venture capital and technology hubs in the United States and Canada, though international respondents contribute to a globally informed baseline.
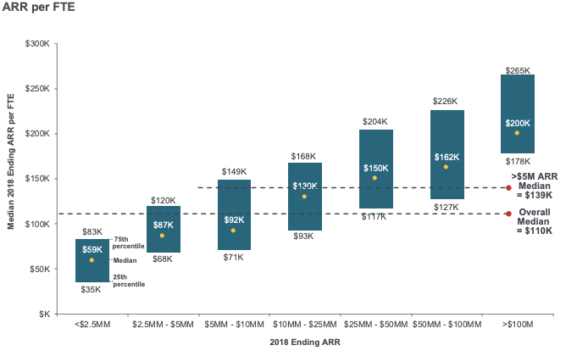
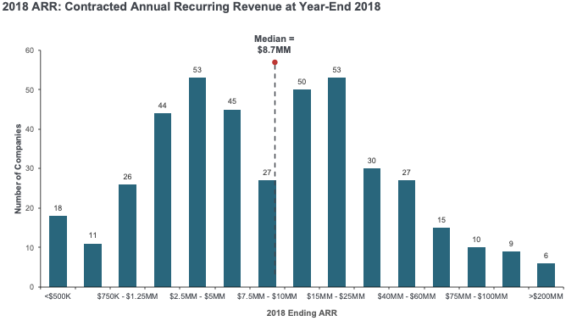
When evaluating company size by ARR distribution, the dataset illustrates a healthy continuum. The majority of respondents represent emerging and mid-market players, with significant representation across brackets ranging from under $2.5 million in ARR up to the $50 million to $100 million tier, alongside a select cohort of elite firms scaling past the $100 million threshold. Furthermore, human capital efficiency—measured through ARR per Full-Time Equivalent (FTE)—demonstrates how organizational productivity scales as companies transition through distinct revenue bands. Early-stage startups navigating sub-$2.5 million ARR structures exhibit vastly different headcount models compared to mature scale-ups operating in the $25 million to $50 million tier, highlighting the delicate balance between aggressive hiring and sustainable output.
Growth Rates and the Growth-versus-Burn Tradeoff
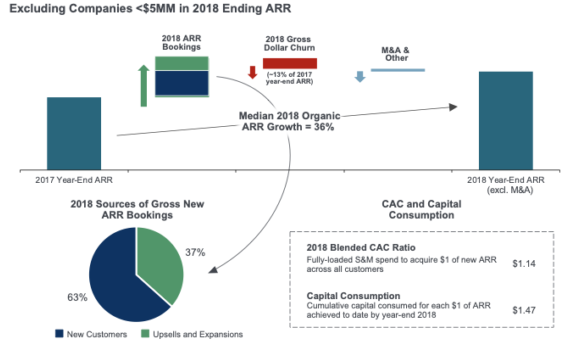
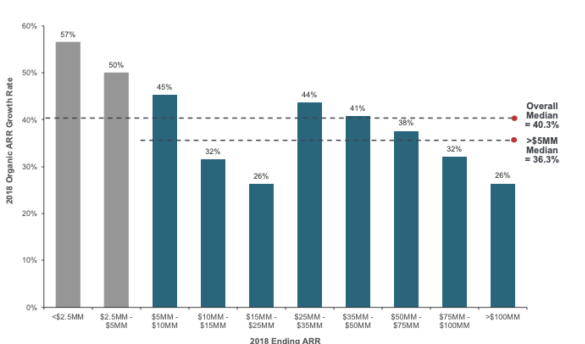
Organic ARR growth remains the primary barometer of success for private SaaS enterprises. According to the 2018 survey data, the median organic ARR growth rate highlights the market’s expectation for rapid scaling, even as individual company trajectories vary significantly based on contract sizes and target customer profiles.
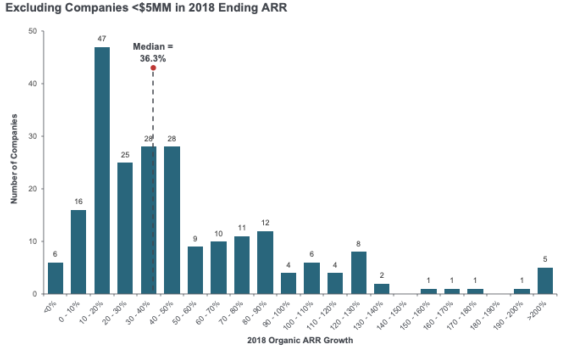
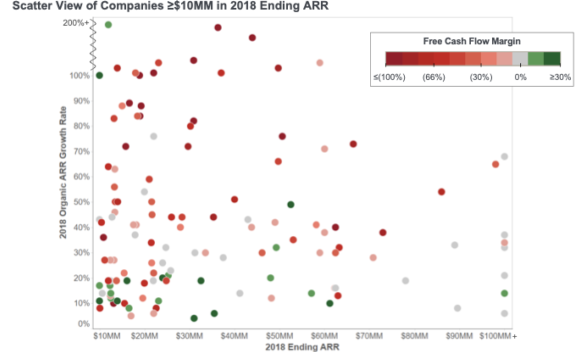
The survey’s analysis of the organic ARR growth histogram reveals a wide dispersion of performance. While high-performing outliers achieve hyper-growth exceeding 100% year-over-year, the median cohort settles into a steady, sustainable expansion rate. However, rapid top-line growth is rarely achieved without capital consumption. The "Growth vs. Burn Tradeoff" analysis underscores a fundamental reality of the SaaS business model: burning capital is frequently a prerequisite for aggressive customer acquisition and market penetration.
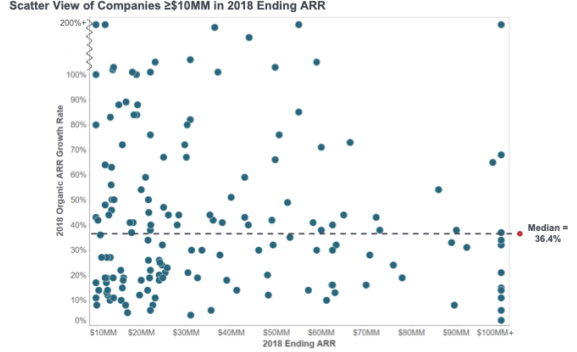
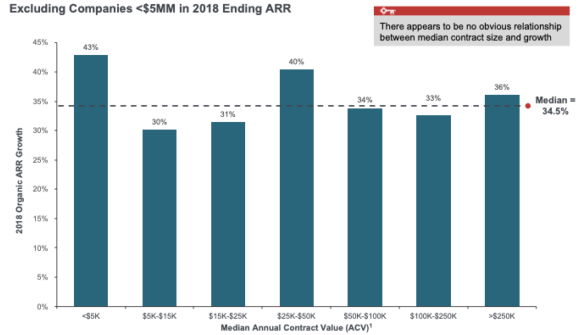
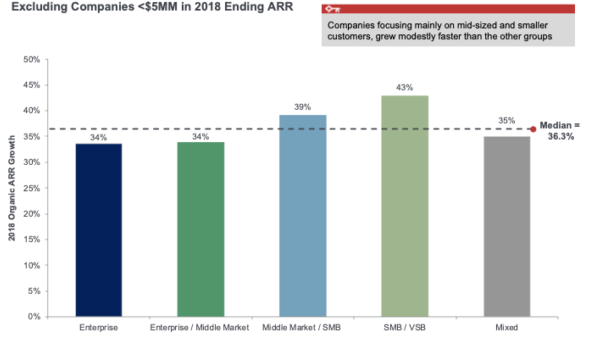
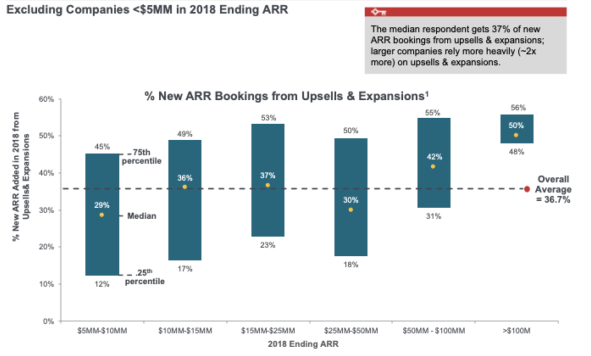
Crucially, the data indicates that median growth rates fluctuate significantly as a function of annual contract value (ACV) and target customer segments. Companies targeting enterprise clients—defined as organizations with over 1,000 employees—frequently command larger median ACVs, which directly influence their go-to-market strategies and sales cycles. Conversely, businesses focused on small and medium-sized businesses (SMBs) or very small businesses (VSBs) rely on higher-volume, lower-touch sales models to achieve aggregate growth. Additionally, reliance on upsells and expansions plays a pivotal role in driving net new ARR, proving that modern SaaS revenue retention and account expansion are just as critical as landing new logos.
Go-To-Market Strategies: Field Sales versus Inside Sales
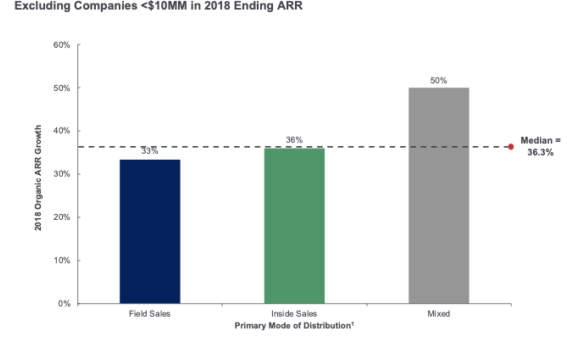
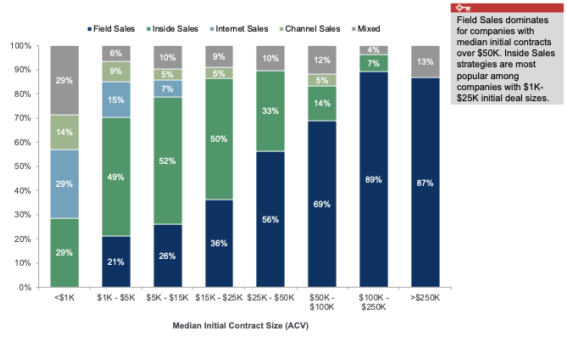
The mechanics of customer acquisition continue to evolve, with organizations carefully evaluating their primary mode of distribution. The survey categorizes distribution strategies into distinct operational motions, prominently featuring field sales and inside sales models, while examining the crossover deal size tiers where organizations frequently transition from one methodology to the other.
Data regarding sales strategies reveals clear correlations with median ARR and deal size. Field sales models dominate among companies securing larger enterprise contracts, where complex sales cycles necessitate dedicated, face-to-face engagement and higher fully-loaded sales and marketing expenditures. In contrast, inside sales models prove highly efficient for mid-market and SMB transactions, where velocity and lower customer acquisition costs are paramount.
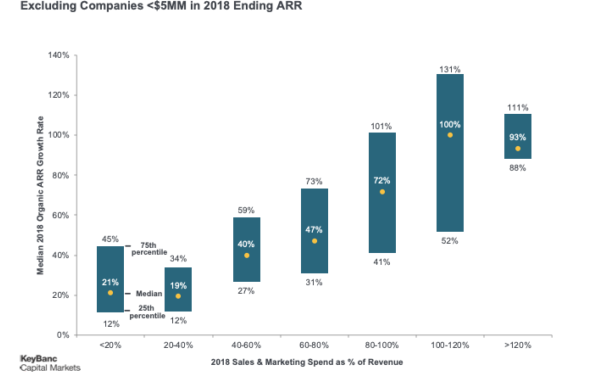
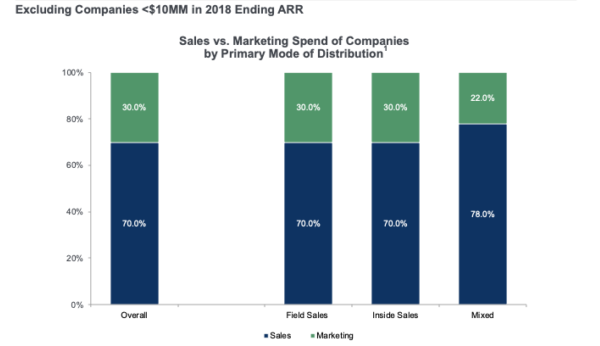
An analysis of sales and marketing (S&M) spend versus growth rate further illuminates the financial commitment required to scale. Companies allocating disproportionate capital to S&M often experience accelerated top-line expansion, provided their unit economics remain sound. The composition of S&M costs—breaking down the exact ratio of sales expenses versus marketing outlays—provides executives with a granular blueprint for optimizing departmental budgets.
Customer Acquisition Cost (CAC) Ratios and Payback Periods
Unit economics form the bedrock of sustainable SaaS operations. The survey provides extensive documentation on CAC ratios, differentiating between blended CAC, new customer acquisition costs, and the cost efficiency of upsells and expansions into existing accounts.

The implied CAC payback period—calculated as the number of months of subscription gross profit required to recover the fully-loaded cost of acquiring a customer—remains one of the most closely watched metrics by investors. The 2018 findings indicate that median CAC payback periods cluster within a predictable historical range, though variances emerge based on the chosen distribution channel. Field-dominated sales motions typically incur longer payback periods due to higher initial customer acquisition costs, which are offset by substantially higher lifetime values (LTV) and larger initial contract sizes.
Capital efficiency metrics, which evaluate cumulative primary equity and debt drawn against net cash positions, reveal that disciplined capital allocation correlates strongly with prolonged runway and minimized dilution. Companies that maintain favorable CAC ratios relative to their capital consumption demonstrate superior operational resilience.
Operational Trends: Infrastructure, Gross Margins, and Commissions
Operational efficiency extends beyond sales and marketing into product delivery and compensation structures. Subscription gross margins among respondents remained exceptionally robust, generally hovering well above industry-standard benchmarks. The survey tracks SaaS application delivery trends, mapping the migration from self-managed servers to dominant cloud infrastructure providers such as Amazon Web Services (AWS), Microsoft Azure, and Google Cloud Platform, as well as hybrid and multi-cloud architectures. Notably, the choice of cloud infrastructure exhibits minimal negative variance on subscription gross margins, cementing the ubiquity and cost-effectiveness of enterprise-grade cloud hosting.
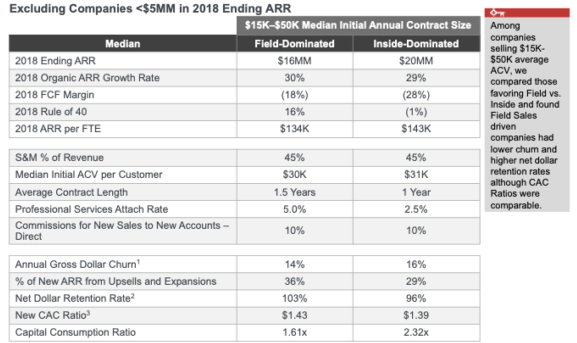
Professional services as a percentage of first-year ARR vary notably by target customer segment. Enterprise-focused SaaS providers frequently require more extensive implementation, customization, and deployment services, whereas SMB-focused platforms lean toward self-service onboarding with minimal professional services overhead.
Compensation structures for sales teams also received rigorous scrutiny in the 2018 report. The analysis of sales commission levels highlights median commission rates across field and inside sales teams, illustrating how compensation scales relative to initial median contract sizes. Furthermore, the survey addresses contemporary policy trends regarding direct commissions for contract renewals, upsells, and multi-year deals, offering valuable benchmarks for compensation committee architects.

Implications and Industry Outlook
The release of the 2018 KBCM Technology Group and forEntrepreneurs SaaS survey results provided the broader tech ecosystem with an indispensable compass during a period of rapid market maturation. By establishing transparent medians across organic growth, capital consumption, go-to-market efficiency, and unit economics, the report empowered executive leadership teams to diagnose operational bottlenecks and calibrate strategic goals.
The empirical findings underscore that while hyper-growth remains the ultimate objective for venture-backed cloud companies, it must be balanced against capital efficiency and sustainable customer acquisition metrics. As market dynamics continue to shift, the longitudinal data provided by this annual survey ensures that founders and financial operators possess the empirical foundation necessary to navigate capital raising, resource allocation, and long-term enterprise value creation.