Unveiling the 2021 SaaS Survey Part 2: Comprehensive Insights into Software-as-a-Service Growth, Metrics, and Market Trends


The release of the second installment of the 2021 SaaS Survey, conducted in strategic partnership with KBCM Technology Group, marks a critical milestone for industry analysts, venture capitalists, and software entrepreneurs alike. Building upon the foundational metrics established in Part 1, this comprehensive deep-dive offers an expansive look into the operational, financial, and strategic benchmarks that defined the Software-as-a-Service (SaaS) sector during a period of rapid pandemic-era digital transformation.
As the global economy continued to navigate the shifting paradigms of remote work, cloud adoption, and enterprise digitization throughout 2021, the demand for scalable software solutions reached unprecedented heights. Consequently, understanding the underlying metrics of these high-growth companies—ranging from customer acquisition costs and net retention rates to sales efficiency and headcount planning—became paramount for leadership teams seeking to scale effectively.
Background and Context of the 2021 SaaS Survey
For over a decade, the annual SaaS Survey published by For Entrepreneurs in collaboration with KBCM has served as the definitive gold standard for benchmarking private and public cloud companies. The survey captures granular data from hundreds of SaaS businesses globally, providing a transparent window into how top-performing organizations operate, monetize, and expand.
The 2021 edition arrives against the backdrop of an extraordinary macroeconomic environment. Driven by low interest rates, aggressive venture capital deployment, and an urgent enterprise need for cloud infrastructure, SaaS valuations soared to historic peaks. However, this hyper-growth environment also brought unique challenges, including intensifying competition for technical talent, rising customer acquisition costs, and increased pressure to maintain efficient growth while scaling operations.
By analyzing the data compiled in Slides 40 through 71 of the official report, industry stakeholders can evaluate how companies adapted to these pressures, optimizing their go-to-market strategies and capital allocation to sustain long-term enterprise value.
Chronology of the Survey Rollout
The publication of the 2021 SaaS Survey followed a carefully structured release schedule designed to digest and disseminate massive quantities of operational data to the tech community:

- Early 2021: Data collection commenced, engaging hundreds of SaaS executives, chief financial officers, and founders across North America and international markets to gather quantitative and qualitative metrics.
- Mid-2021: Data aggregation, cleansing, and analytical modeling performed by the research teams at KBCM and For Entrepreneurs to identify emerging industry trends and performance percentiles.
- October 2021 (Part 1 Release): The initial findings were published, focusing on foundational startup metrics, early-stage growth trajectories, initial funding milestones, and foundational go-to-market motions.
- Late 2021 (Part 2 Release): The second and final installment was launched, offering deeper visibility into advanced financial metrics, organizational scaling, international expansion, retention dynamics, and long-term economic sustainability.
Key Data Insights from Part 2
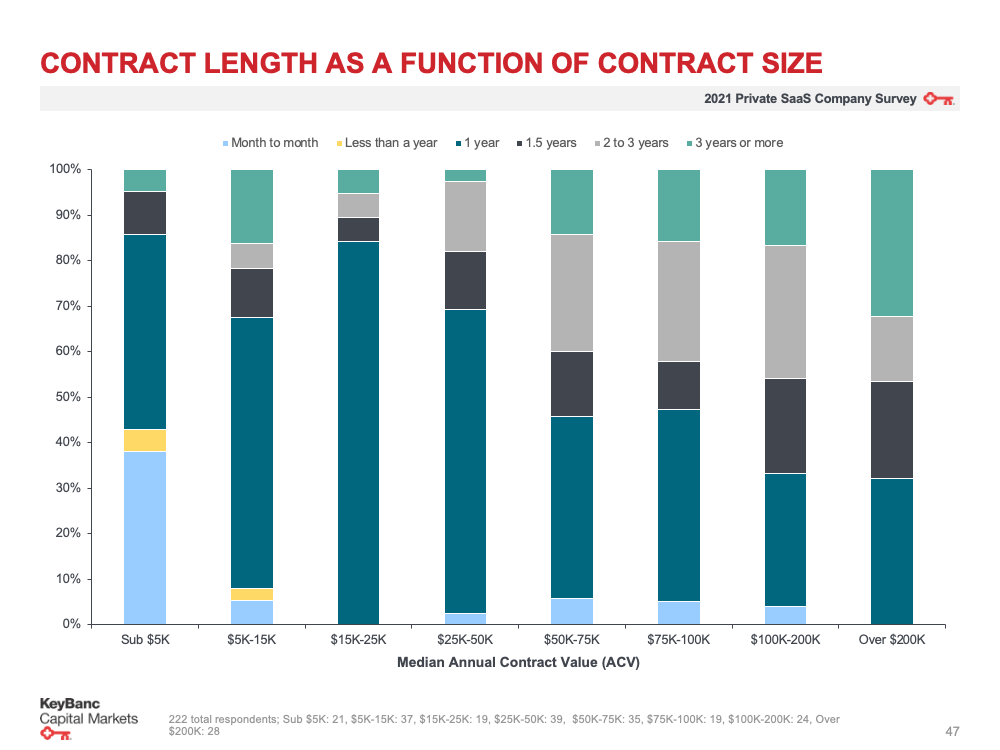
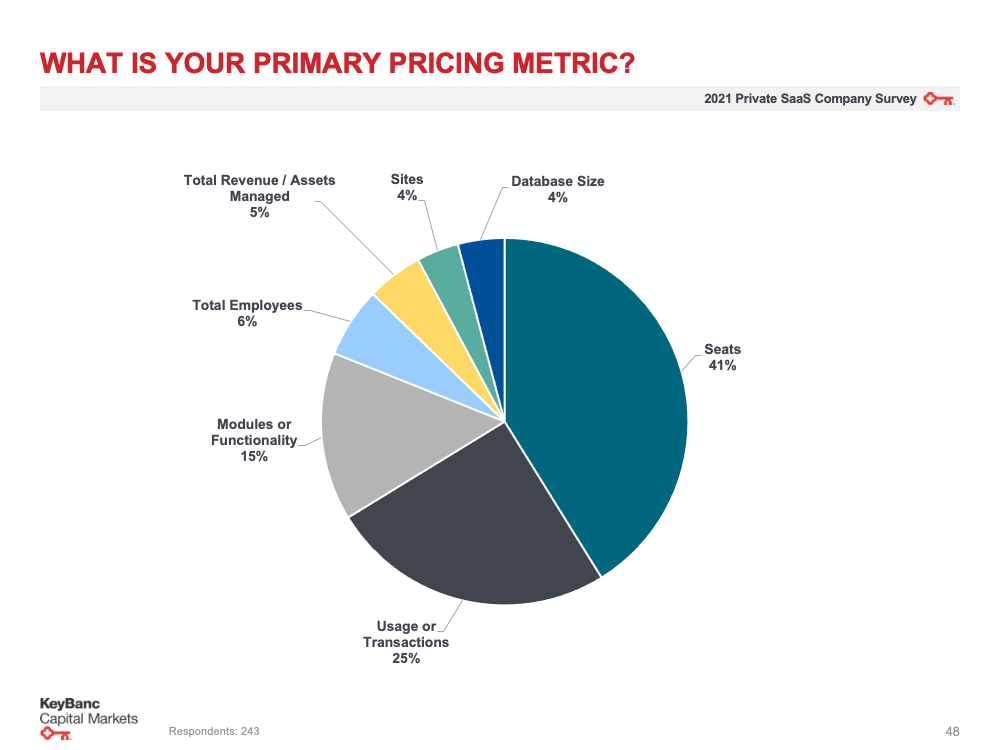
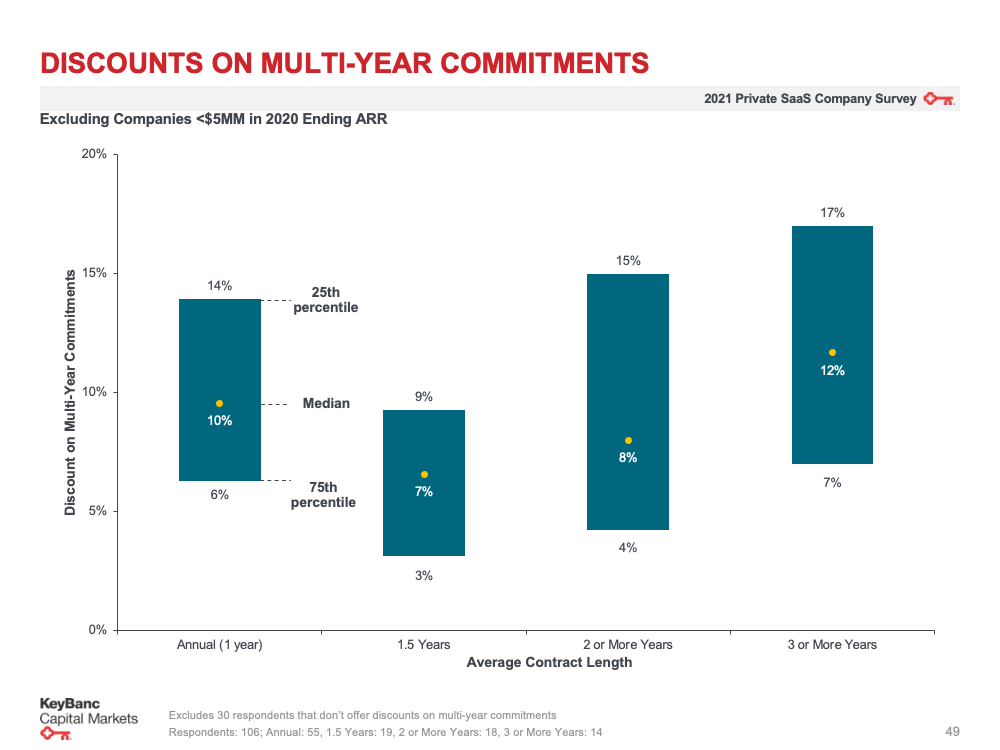
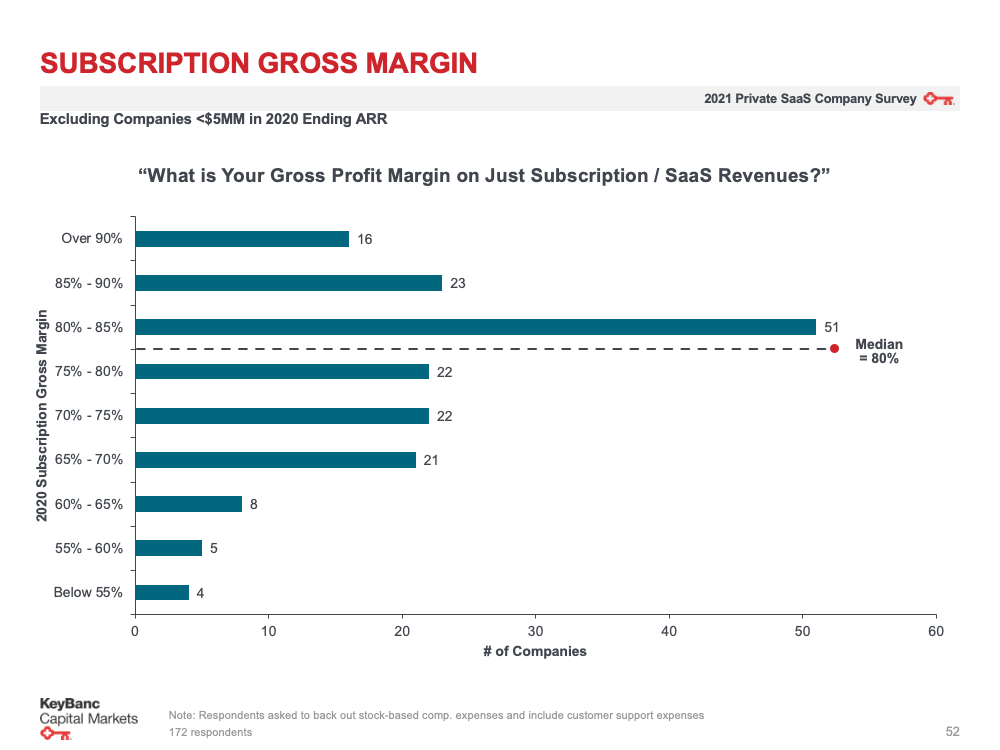
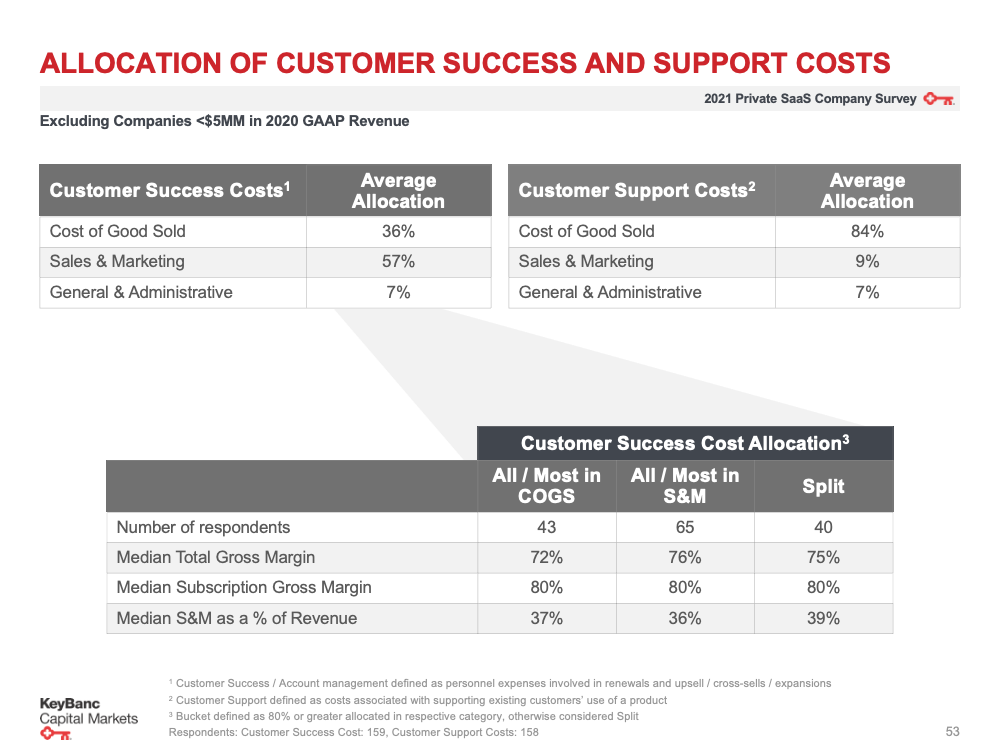
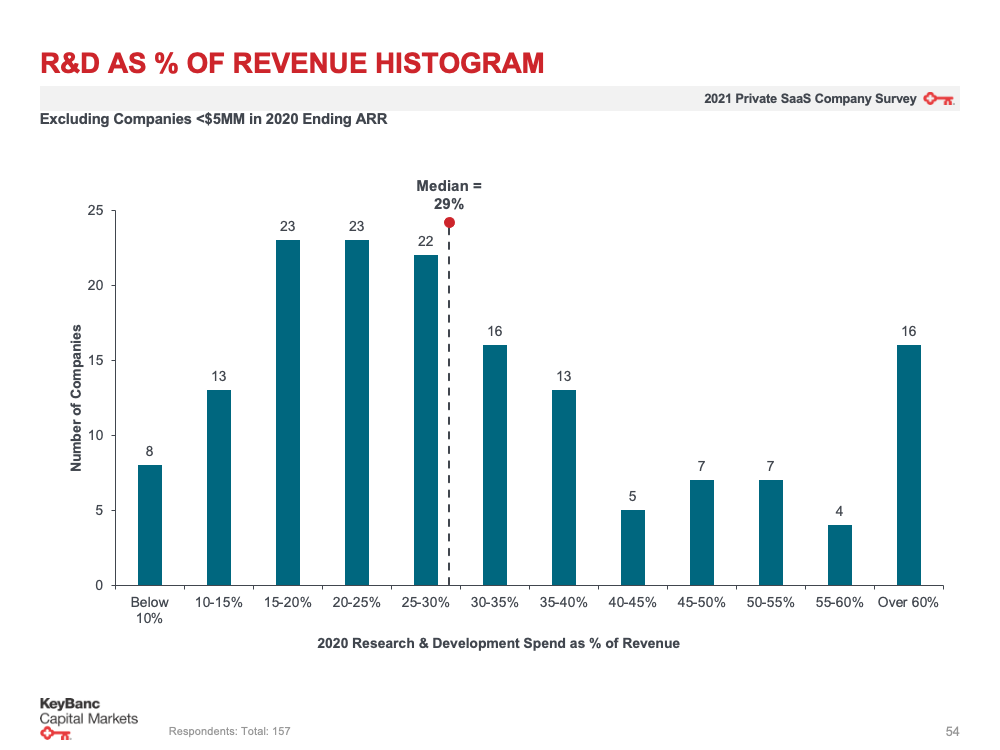
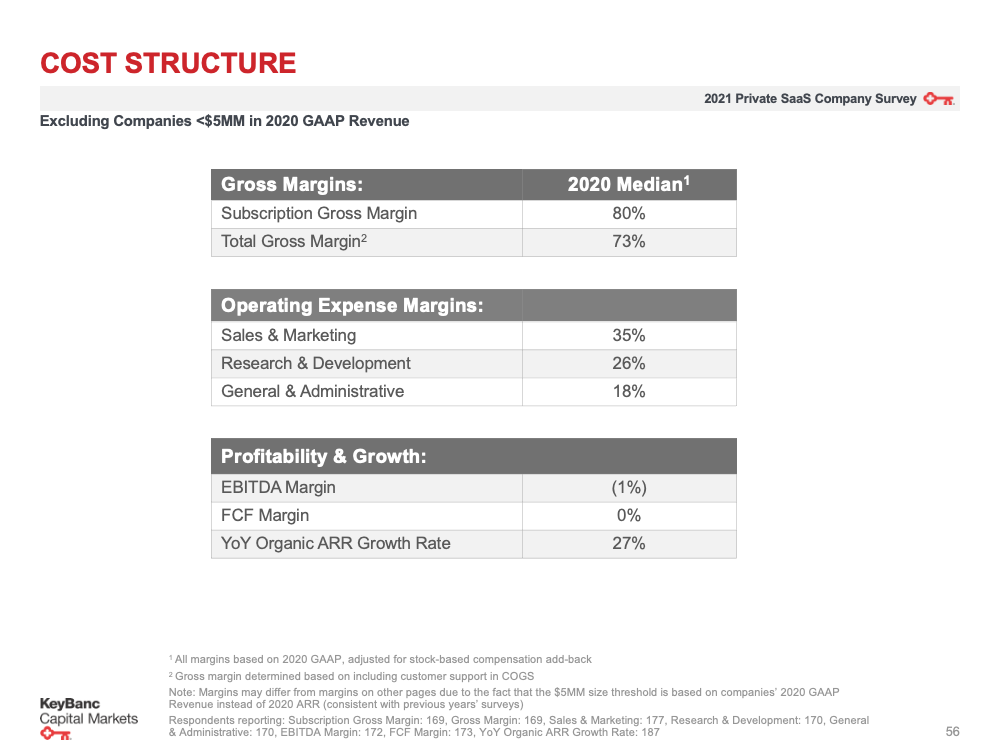
The visual data slides accompanying the second part of the survey—spanning from Slide 40 to Slide 71—illuminate several crucial operational vectors for modern software companies. While the raw charts provide a visual distribution of performance across the SaaS landscape, several core themes emerge from the aggregated data:
Customer Retention and Net Expansion
One of the most heavily scrutinized metrics in the SaaS business model is Net Retention Rate (NRR), which measures a company’s ability to retain and expand revenue from existing customers over time. The 2021 data highlights that elite SaaS companies continue to achieve NRR figures well above 100%, often exceeding 120% for enterprise-focused software providers. This growth is primarily driven by effective upselling, cross-selling additional product modules, and accommodating user seat expansion within client organizations.
Conversely, gross churn rates remained a critical indicator of product-market fit. Companies maintaining low logo churn successfully insulated themselves against macroeconomic volatility, ensuring a predictable and recurring revenue baseline that appeals strongly to institutional investors.
Sales and Marketing Efficiency
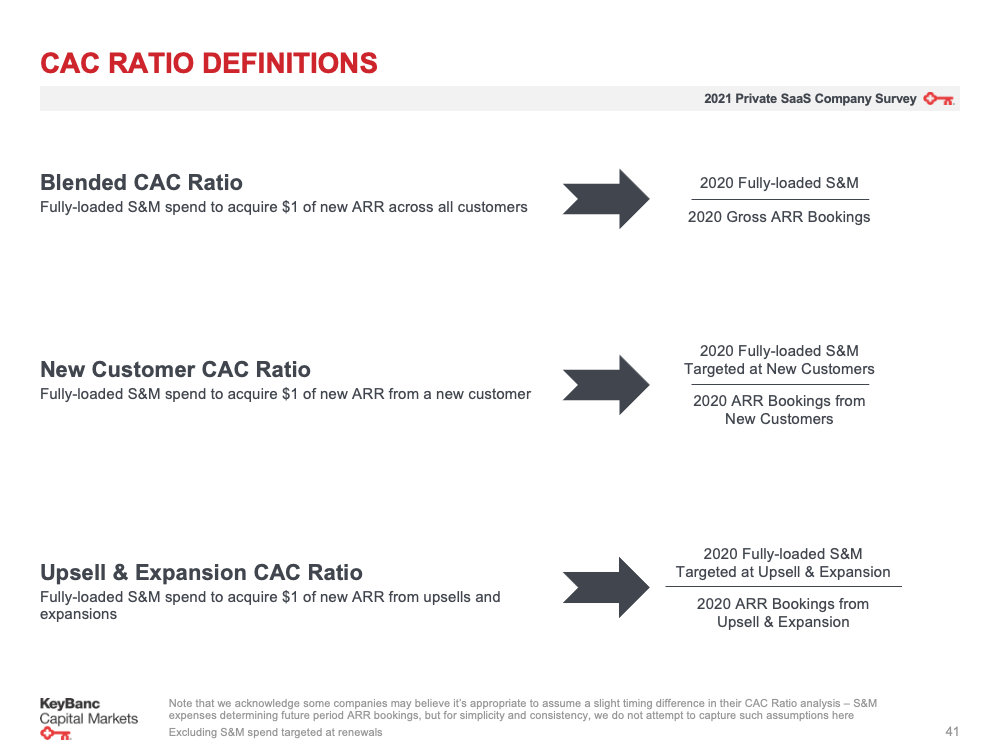
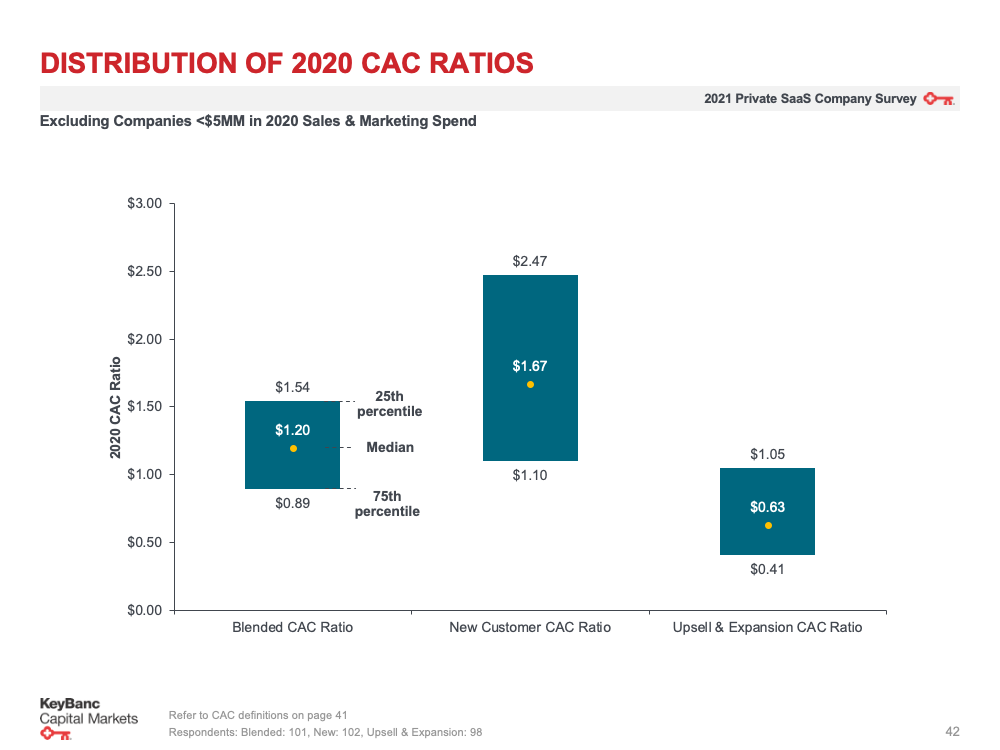
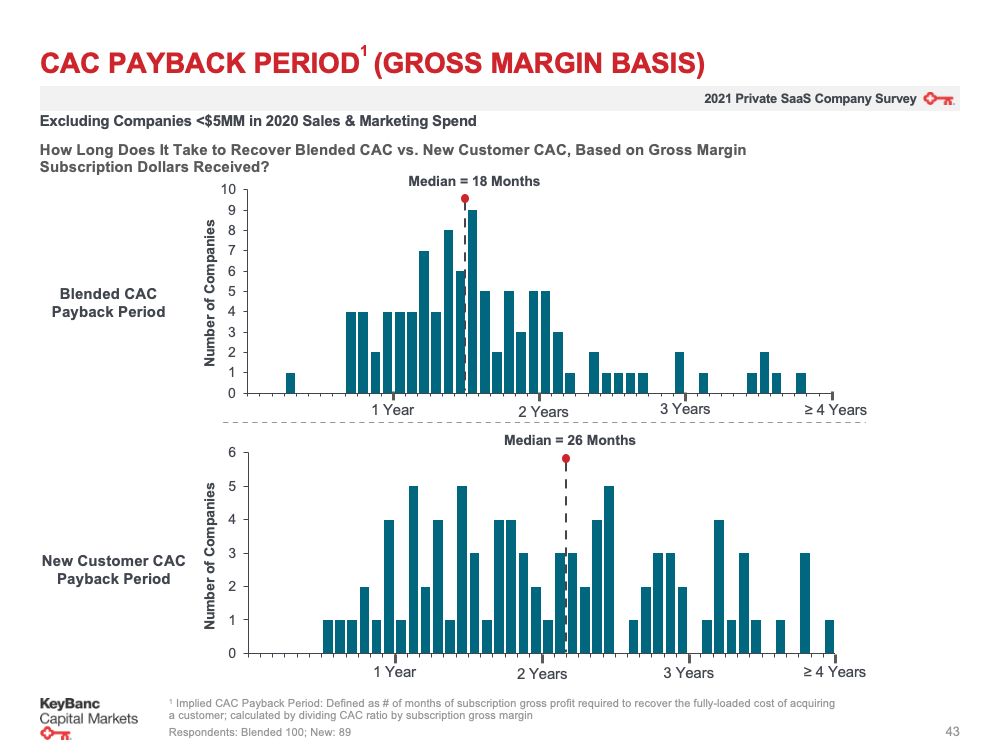
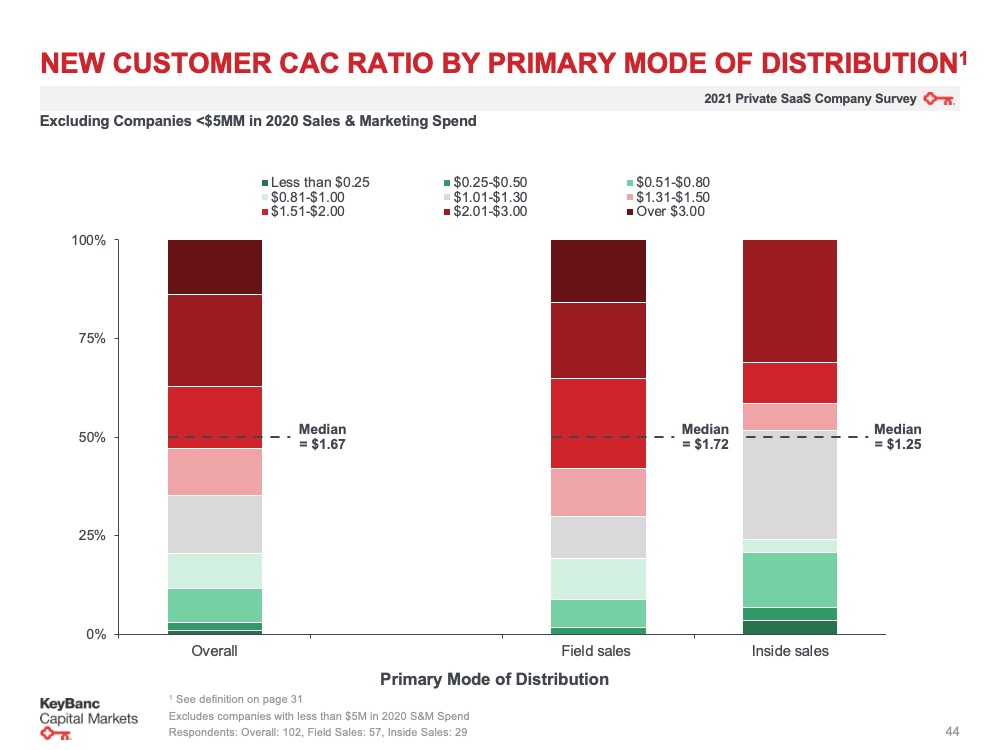
The survey data sheds light on the evolving dynamics of customer acquisition costs (CAC) and the payback period required to recover those upfront investments. As digital channels became increasingly crowded, customer acquisition costs experienced upward pressure across various market segments.
To counteract this, top-performing SaaS businesses increasingly leaned into product-led growth (PLG) motions, utilizing freemium models and self-service onboarding to lower friction for prospective buyers. For enterprise sales teams, the data underscores the necessity of optimizing pipeline conversion rates and shortening sales cycles to maintain healthy LTV-to-CAC ratios.

Capital Efficiency and Burn Multiples
With venture capital and private equity firms placing a renewed emphasis on sustainable growth rather than "growth at all costs," the metrics surrounding cash burn took center stage in 2021. The survey examines the "Burn Multiple"—a metric calculated by dividing net burn by net new Annual Recurring Revenue (ARR). The data illustrates a wide variance across cohorts, but reinforces the reality that top-tier efficient growers generate significantly more revenue per dollar of cash consumed, providing a vital buffer against potential tightening in capital markets.
Industry Reactions and Expert Analysis
Financial analysts and venture capital partners have widely praised the 2021 report for its unmatched depth and clarity. Industry observers note that the dataset provides essential guardrails for founders navigating board meetings and fundraising rounds.
"In a market characterized by rapid shifts in valuation multiples and investor sentiment, having access to empirical benchmarks is non-negotiable," noted a leading technology sector analyst. "The KBCM and For Entrepreneurs partnership delivers precisely that—a reality check for management teams balancing aggressive top-line expansion with fundamental unit economics."
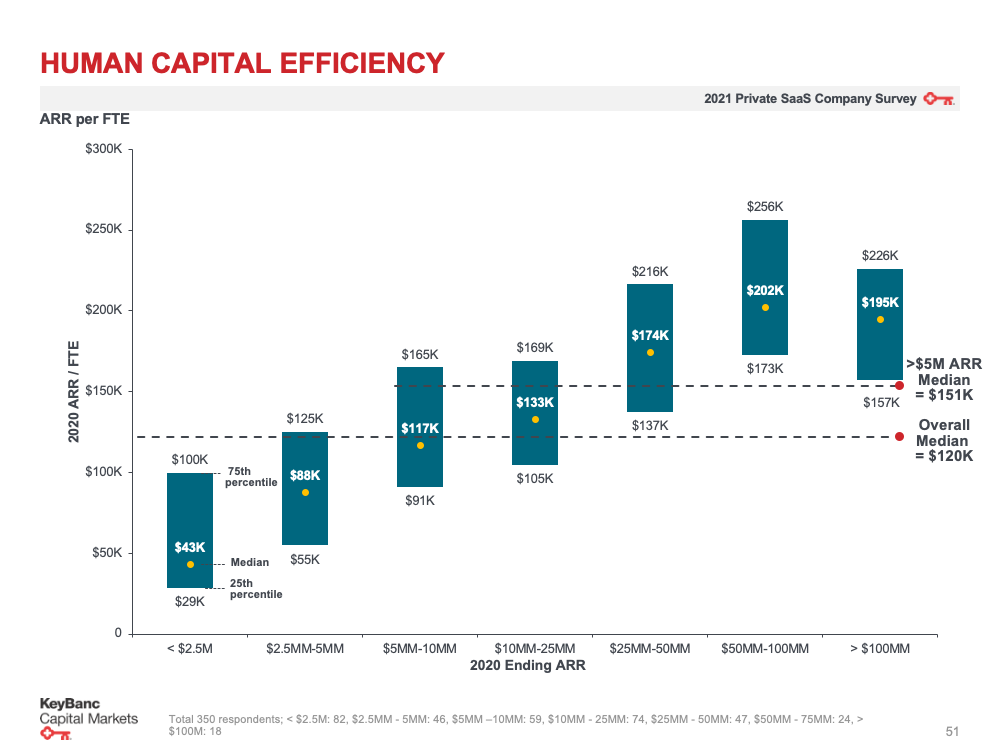
Furthermore, human resources and operations leaders have utilized the survey’s compensation and headcount productivity benchmarks to restructure organizational charts. With remote and hybrid work models becoming permanent fixtures of the tech landscape, data regarding geographic pay differentials and organizational efficiency per employee has proven invaluable for workforce planning.
Broader Impact and Strategic Implications
The implications of the 2021 SaaS Survey extend far beyond academic interest; they actively shape corporate strategy, product roadmaps, and financial forecasting for thousands of enterprises.

As the software industry matures, the margin for operational error narrows. Companies can no longer rely solely on broad market tailwinds to drive valuation increases. Instead, sustainable success requires rigorous adherence to the performance benchmarks highlighted in the survey—such as maintaining top-decile net retention, optimizing sales productivity, and exercising disciplined capital allocation.
For early-stage entrepreneurs, Part 1 and Part 2 of the survey together act as a strategic playbook, outlining the precise operational milestones required to transition from a seed-funded startup to a multi-hundred-million-dollar enterprise. For later-stage executives, the metrics serve as a diagnostic tool to identify operational bottlenecks and benchmark departmental performance against industry peers.
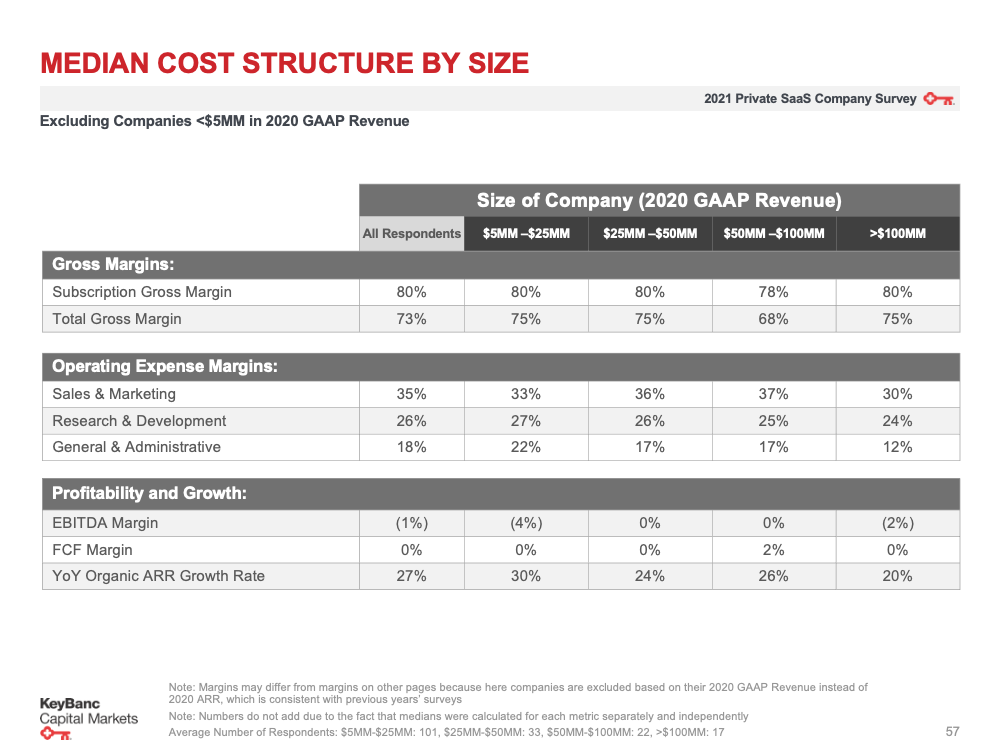
Stakeholders seeking the complete, unedited dataset, alongside downloadable presentation decks and executive summaries, can access the full report via the official 2021 KBCM SaaS Survey PDF. To review the foundational metrics and initial findings, readers can also revisit the First Part of the 2021 SaaS Survey, ensuring a holistic understanding of the technological and financial trends that continue to shape the modern software economy.