Unveiling the 2021 SaaS Survey Part 2: Comprehensive Insights, Metrics, and Strategic Benchmarks for Software Enterprises


The software-as-a-service (SaaS) industry has experienced unprecedented structural shifts, rapid scaling phases, and evolving macroeconomic pressures over recent years. To help founders, executives, venture capitalists, and industry stakeholders navigate this hyper-competitive landscape, the release of the second part of the 2021 SaaS Survey—conducted in partnership between ForEntrepreneurs and KBCM Technology Group—provides an exhaustive look at the operational, financial, and strategic health of modern software companies. Following the foundational insights established in the first installment, this second segment dives deeper into critical performance metrics, Go-To-Market (GTM) strategies, sales efficiency, customer acquisition costs, retention dynamics, and long-term valuation drivers. For professionals seeking to benchmark their organizational performance against industry peers, the complete 2021 KBCM SaaS Survey is available as a downloadable PDF resource, offering granular data derived from hundreds of participating B2B software companies.

Background and Context of the 2021 SaaS Survey
To fully appreciate the data presented in the 2021 survey, it is essential to contextualize the macroeconomic environment in which these software companies operated. The year 2021 represented a unique inflection point for the global technology sector. Following the initial market disruptions of 2020 driven by the COVID-19 pandemic, businesses across all sectors accelerated their digital transformation initiatives. Cloud adoption skyrocketed, remote work infrastructure became permanent, and enterprise software budgets expanded significantly.
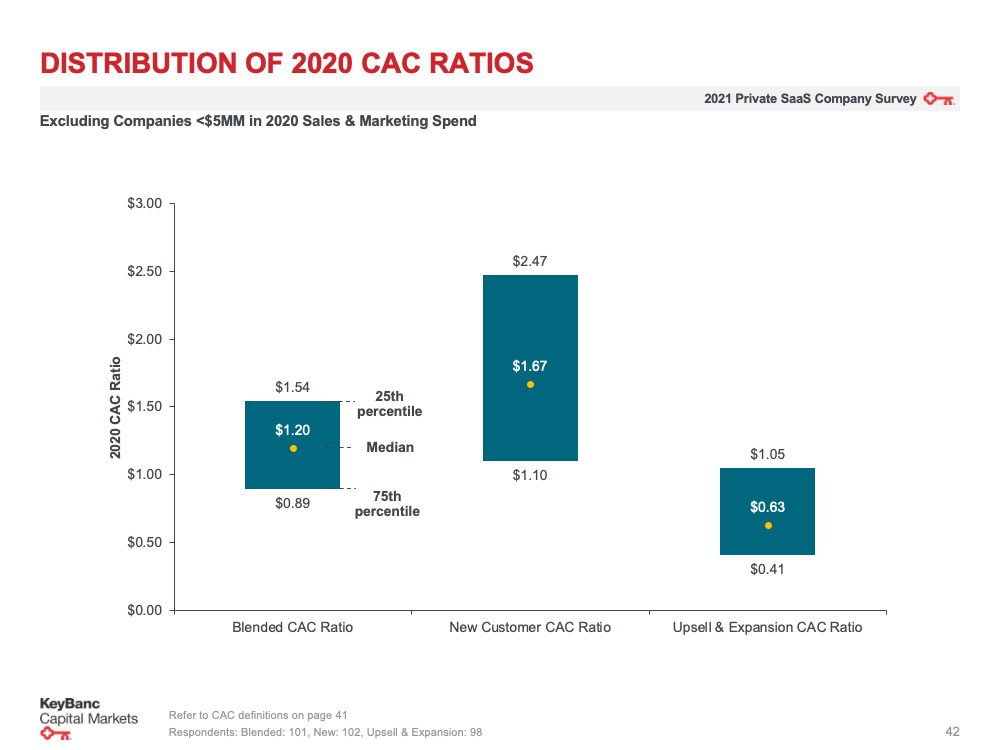
However, this rapid demand growth also triggered heightened competition, soaring customer acquisition costs (CAC), and fierce battles for top-tier engineering, sales, and executive talent. Venture capital and private equity deployment reached historic highs, pushing valuations to astronomical multiples. In this climate, vanity metrics such as top-line Annual Recurring Revenue (ARR) growth were no longer sufficient to guarantee long-term viability. Investors and boards increasingly demanded proof of capital efficiency, robust net retention rates, and sustainable unit economics.
The ForEntrepreneurs and KBCM SaaS Survey has long stood as the gold standard for empirical data within the B2B software ecosystem. By collecting granular financial and operational metrics from a diverse cohort of private and public SaaS companies ranging from early-stage startups to mature enterprises exceeding $100 million in ARR, the survey bridges the information gap. It equips founders with the empirical data needed to make informed decisions regarding pricing models, sales team structures, research and development spending, and international expansion.
Chronology and Structural Overview of the Research

The rollout of the 2021 SaaS Survey was meticulously structured to deliver digestible yet comprehensive insights to the tech community. Recognizing the sheer volume of data gathered from participating enterprises, the findings were bifurcated into two distinct, highly detailed publications.
The journey began with the publication of the 2021 SaaS Survey Part 1, which laid the groundwork by examining fundamental corporate characteristics, top-line growth rates, customer segmentation, pricing strategies, and initial cohort performance. Part 1 served as an essential baseline, allowing companies to compare their growth velocity and average contract values (ACVs) against peers targeting similar market segments, whether Small and Medium Businesses (SMBs), mid-market accounts, or large enterprise clients.
Building directly upon those foundational metrics, the release of Part 2 shifts the analytical lens toward internal operational mechanics and financial efficiency. While Part 1 answered the question of "How fast are SaaS companies growing and where do they sell?", Part 2 tackles the more complex questions of "How efficiently are they scaling, how much is it costing them to acquire and retain customers, and how are they structuring their capital and operational expenditures?" Through a series of detailed visual data slides and analytical breakdowns, Part 2 explores the nuanced levers that separate hyper-growth category leaders from stagnant or inefficient competitors.
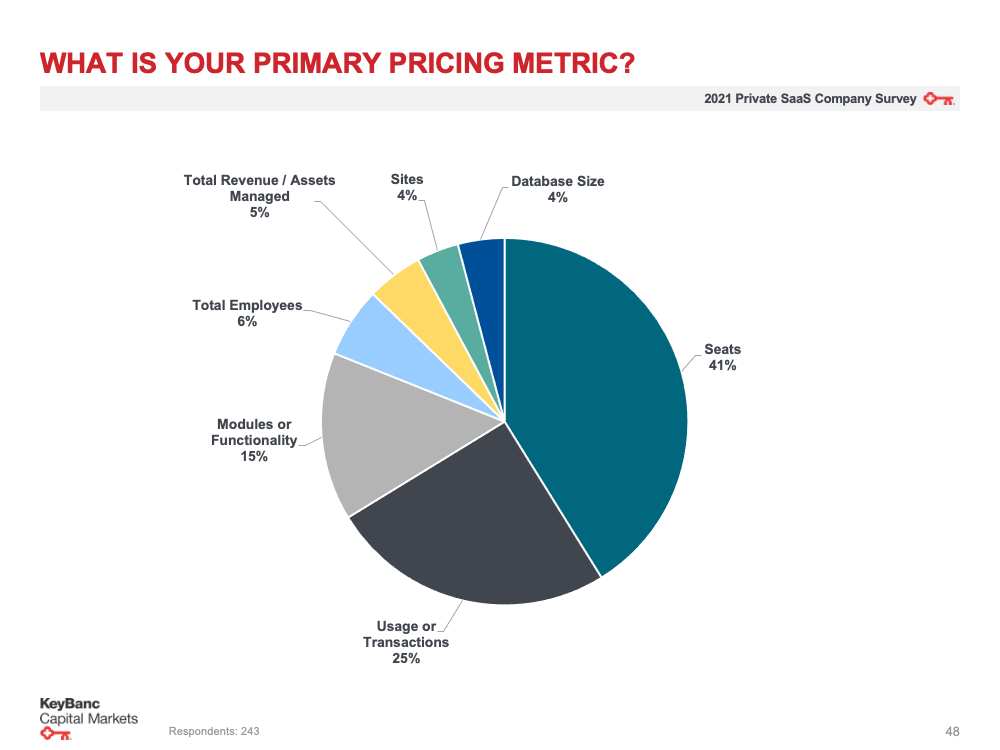
Key Data Points and Metric Analysis from Part 2
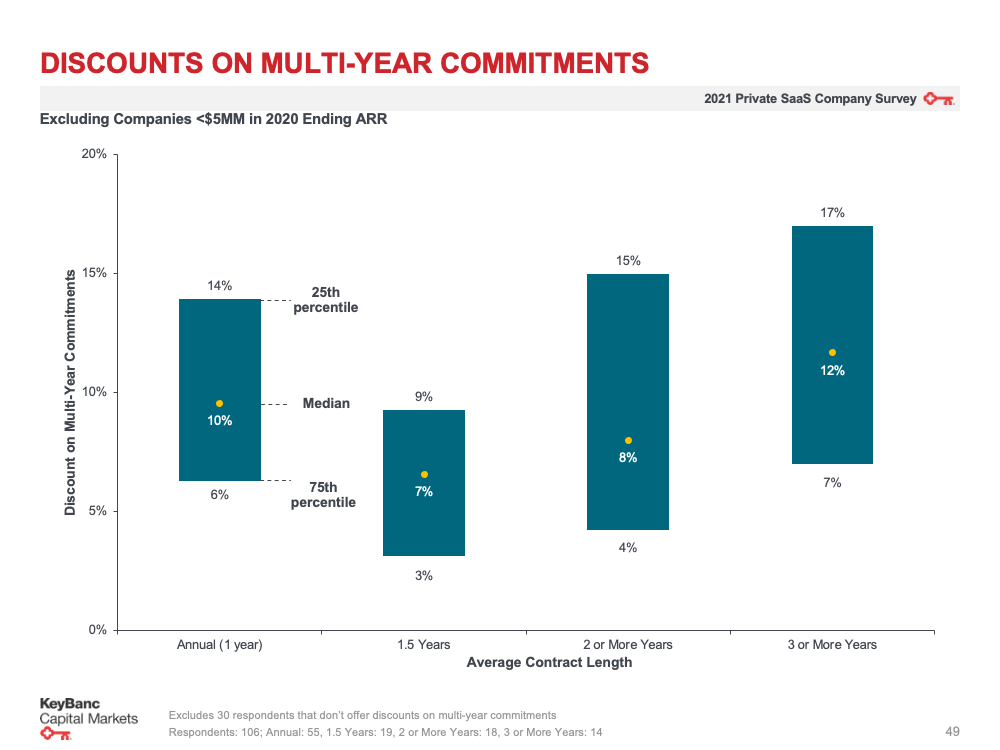
The second installment of the survey is packed with empirical data across multiple operational dimensions. A careful review of the slide deck highlights several critical areas of interest for modern SaaS management teams:

Sales and Marketing Efficiency
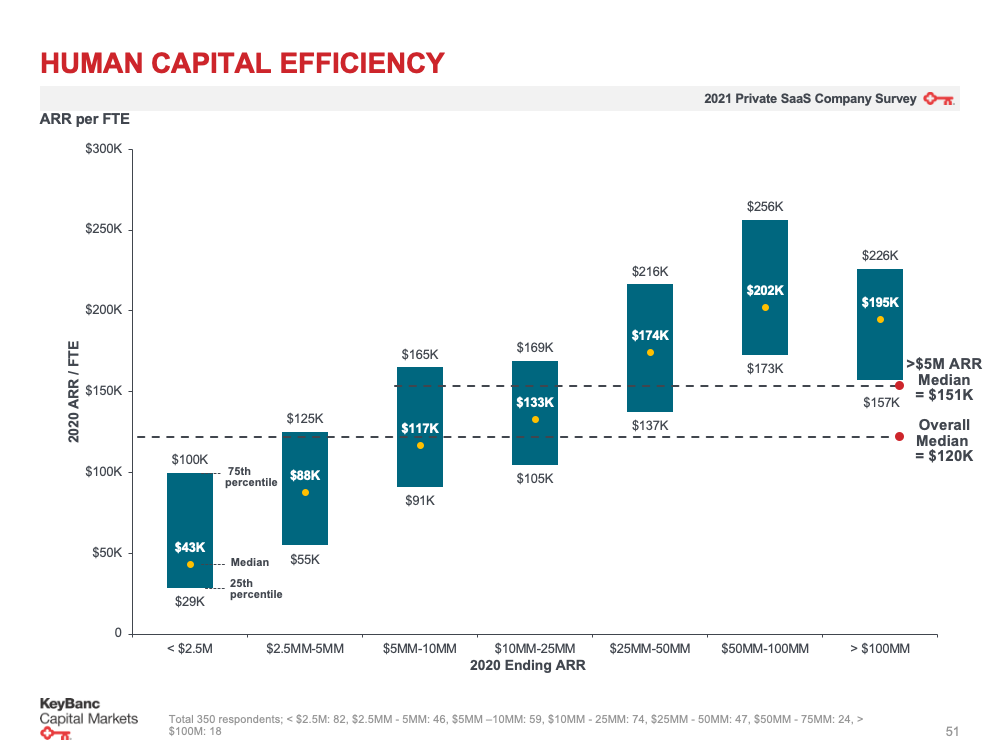
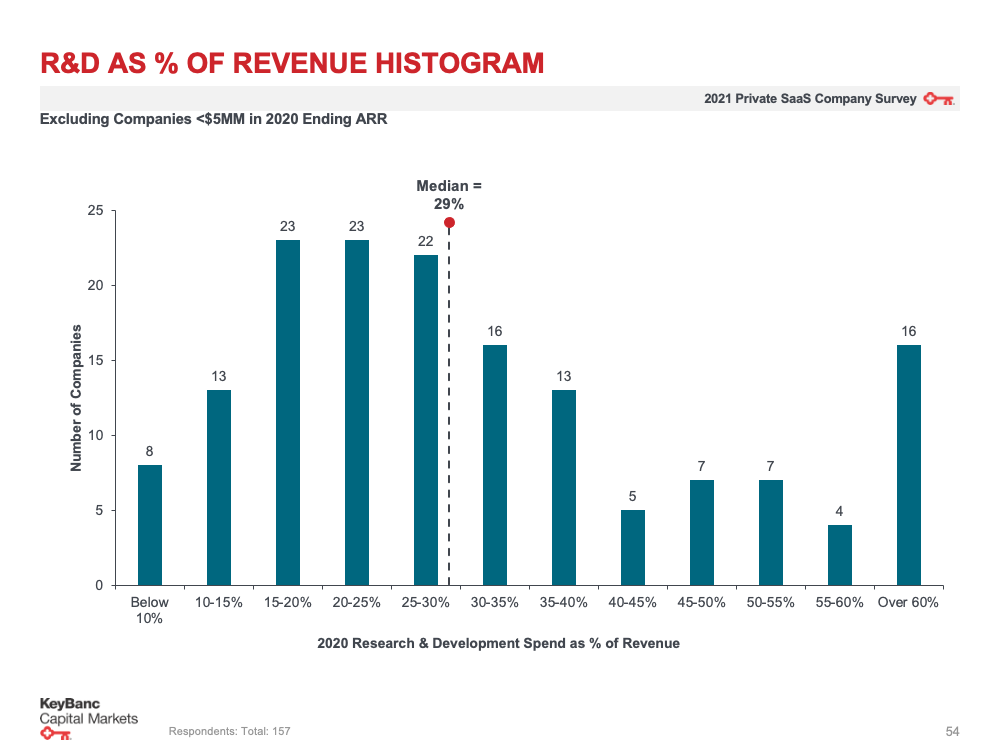
One of the most heavily scrutinized areas in any software business is Go-To-Market (GTM) efficiency. The survey data reveals fascinating trends regarding Sales and Marketing (S&M) expenditures as a percentage of total revenue. As companies scale past the $10 million and $50 million ARR milestones, S&M spend typically rationalizes, shifting from aggressive, burn-heavy customer acquisition to more targeted account-based marketing (ABM) and customer success-driven expansion.
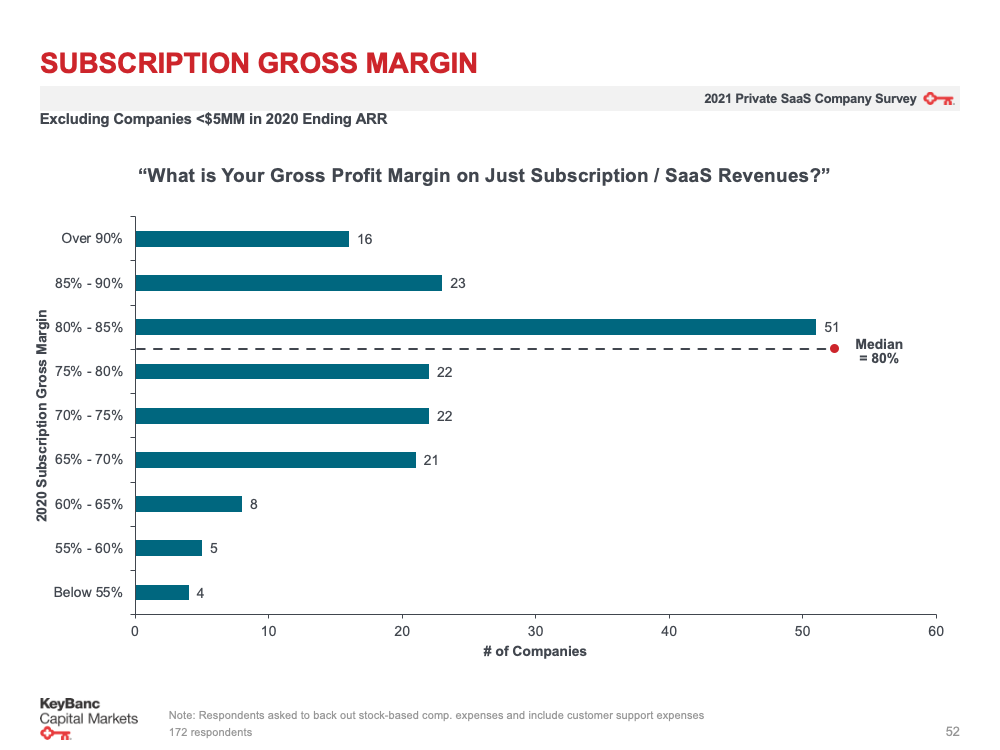
Furthermore, the data examines the Magic Number—a widely accepted metric for measuring sales and marketing efficiency. A higher Magic Number indicates that every dollar spent on sales and marketing is generating a substantial return in new recurring revenue. The survey provides updated benchmarks across different company sizes, highlighting how top-quartile performers manage to maintain high sales velocity without degrading their gross margins.
Customer Acquisition Cost (CAC) Payback Periods
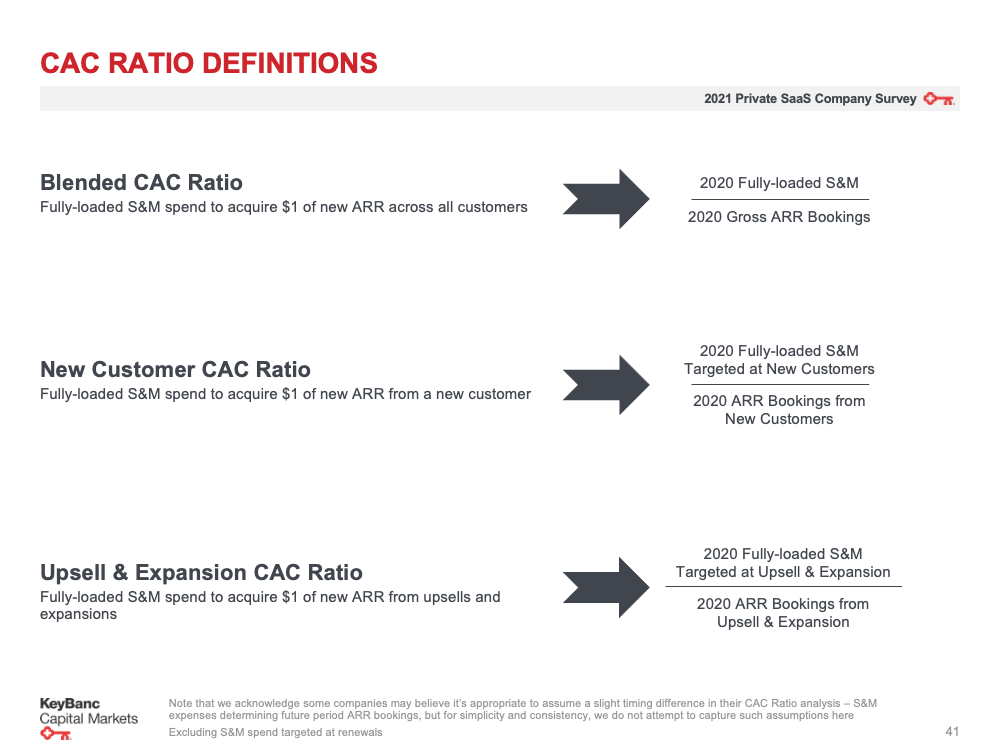
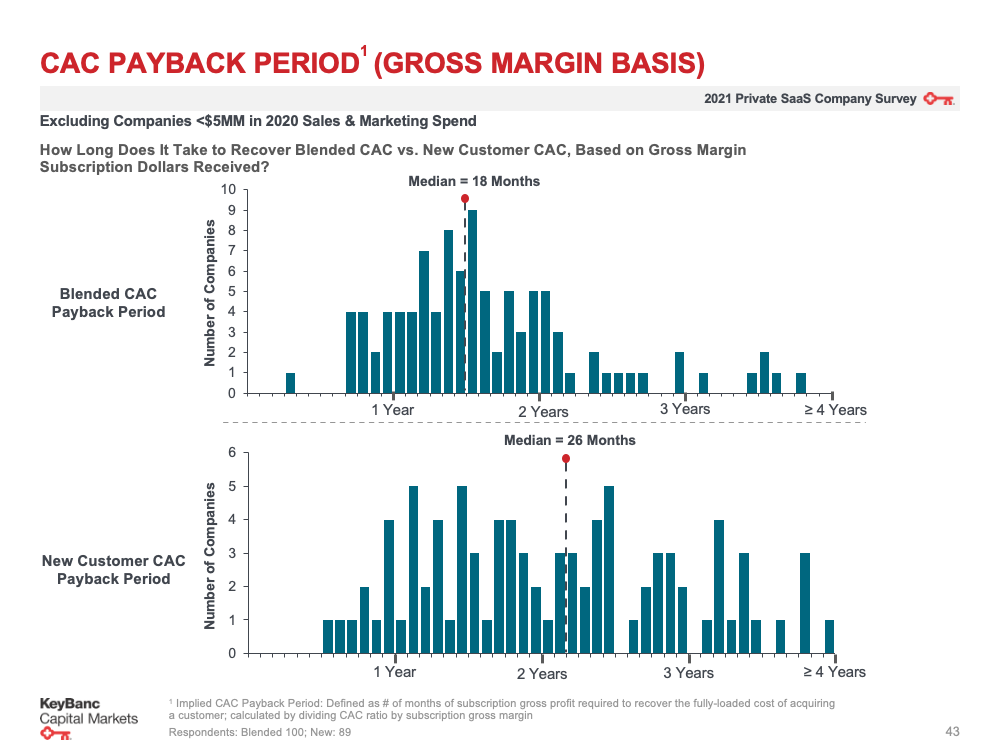
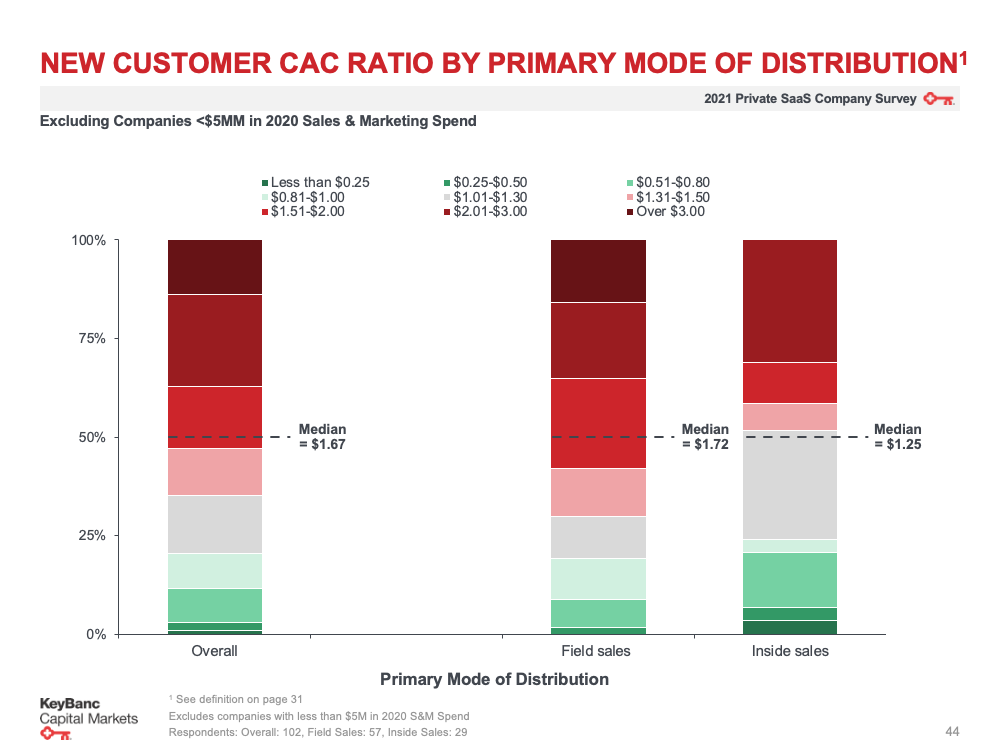
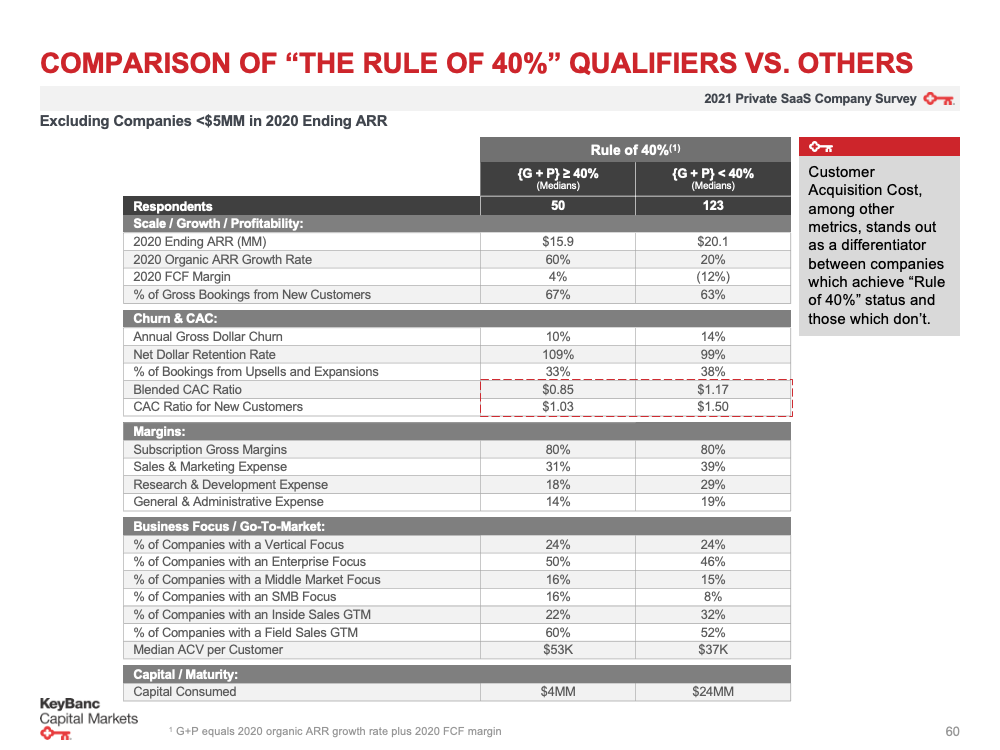
Acquiring a new B2B software customer has become progressively more expensive. Part 2 of the survey investigates CAC payback periods—the number of months it takes for a company to recoup the fully loaded cost of acquiring a customer through their gross margin contributions. The findings underscore a widening gap between top-tier performers, who leverage product-led growth (PLG) or highly optimized inbound funnels to achieve payback periods of under 12 months, and lagging enterprises whose payback periods stretch past 24 months, increasing their reliance on external venture funding.

Net Revenue Retention (NRR) and Churn Dynamics
In the modern SaaS landscape, gross retention is important, but Net Revenue Retention (NRR) is the ultimate litmus test of product-market fit and customer value realization. The survey data confirms that elite SaaS companies consistently achieve NRR figures exceeding 115% to 120%, driven by robust upsell, cross-sell, and seat expansion motions that more than offset normal logo churn. Part 2 breaks down NRR performance by ACV size and target market, proving that enterprise-focused SaaS vendors generally enjoy higher net retention due to lower baseline churn and deeper institutional integration.
Research and Development (R&D) and Infrastructure Investment
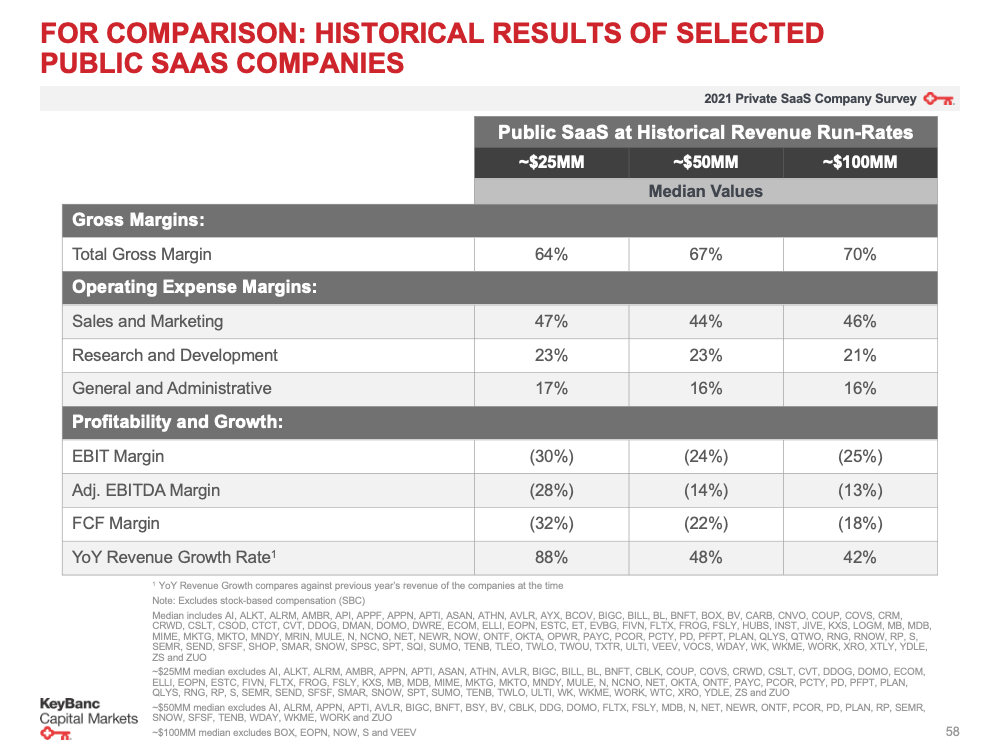
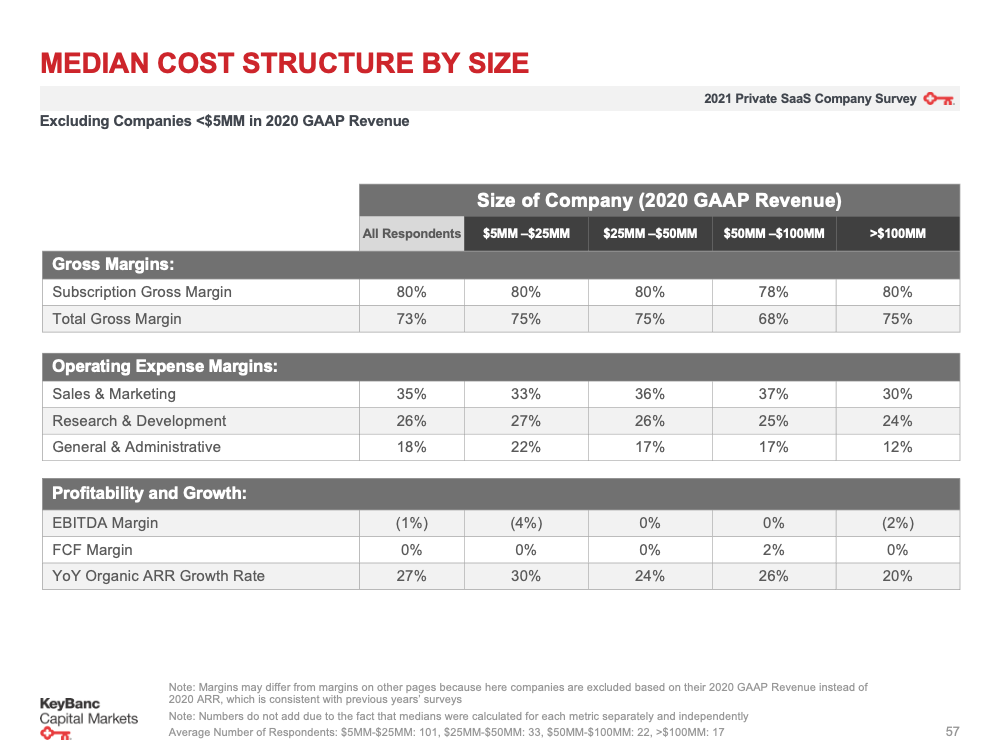
Maintaining a competitive edge in software requires continuous innovation. The survey evaluates R&D expenditure allocations, showing how much revenue successful SaaS firms reinvest into product development, engineering talent, and technical infrastructure. The data illustrates a direct correlation between sustained R&D investment and long-term pricing power, particularly for companies operating in complex technological domains such as artificial intelligence, cybersecurity, and cloud data infrastructure.
Official Responses and Industry Implications
While surveys of this magnitude are analytical instruments rather than political or corporate announcements, the implicit statements and reactions from venture capitalists, startup founders, and financial analysts shed light on the survey’s real-world impact.
Industry thought leaders and venture partners who regularly review the KBCM dataset have emphasized that the 2021 survey results served as an early warning system for the market correction that unfolded in subsequent years. By highlighting rising CAC trends and narrowing efficiency margins among mid-tier performers, the data signaled to boardrooms that an over-reliance on cheap capital and unbridled top-line growth was reaching its logical conclusion.

Founders utilizing the survey have reported utilizing the benchmarks to restructure their departmental budgets, justify increased investment in customer success to their boards, and refine their outbound sales motions. By anchoring strategic planning in empirical industry medians and top-quartile thresholds, management teams are better equipped to navigate investor diligence and secure favorable financing terms.
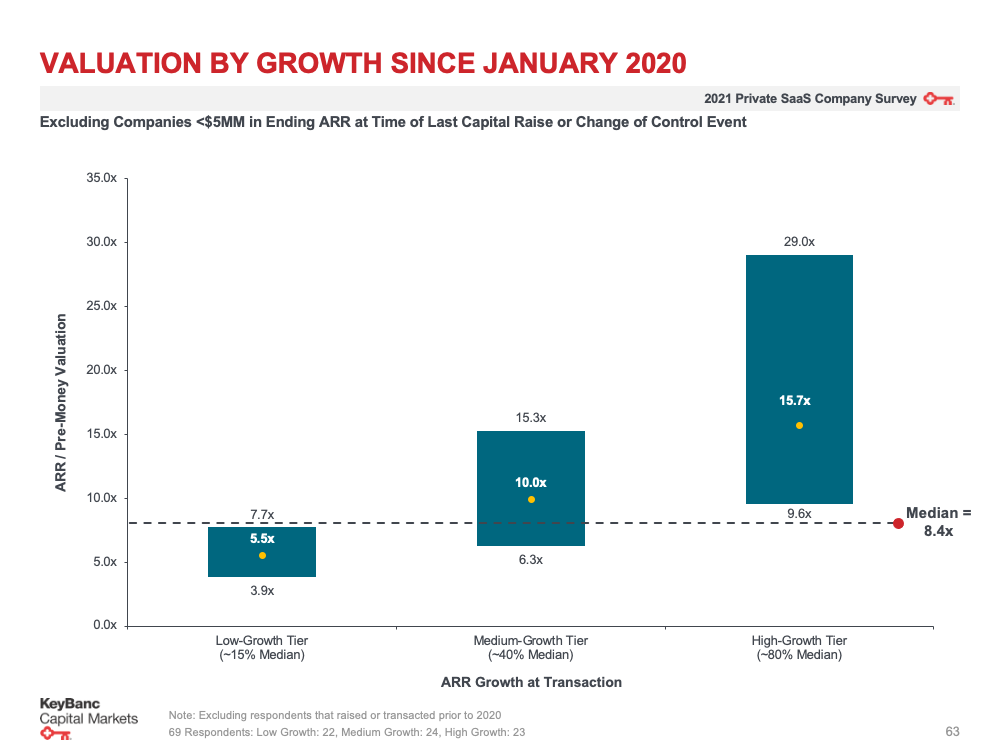
Broader Impact and Strategic Takeaways for Software Enterprises
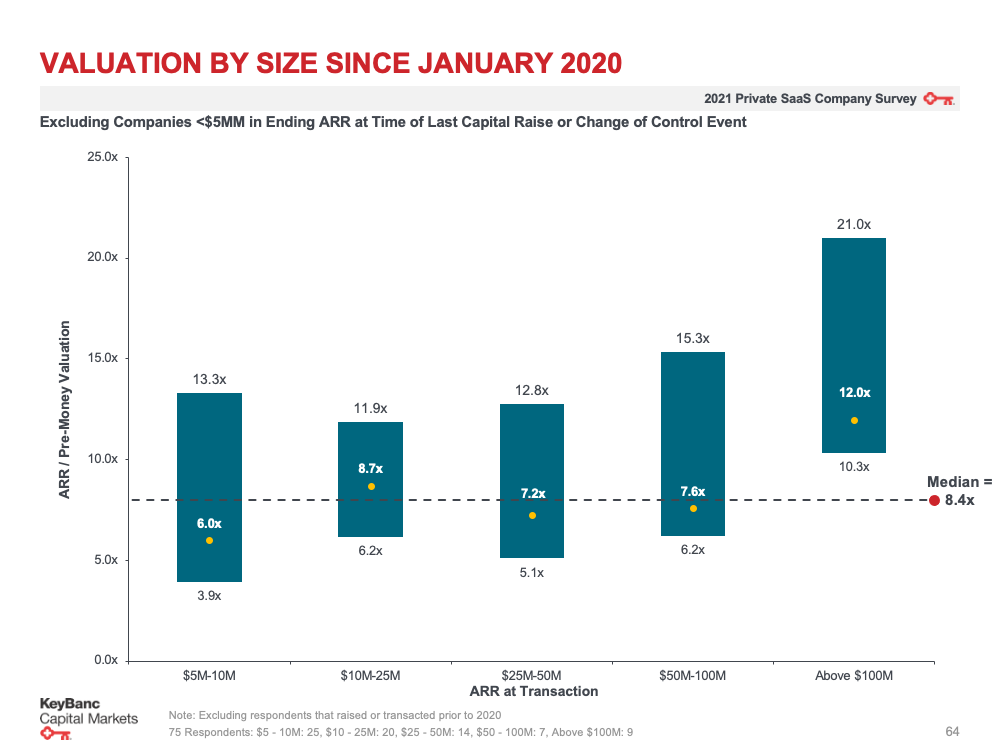
The publication of the 2021 SaaS Survey Part 2 transcends mere academic interest; it serves as an actionable playbook for software executives navigating an increasingly complex global economy. Several overarching implications emerge from the comprehensive dataset:
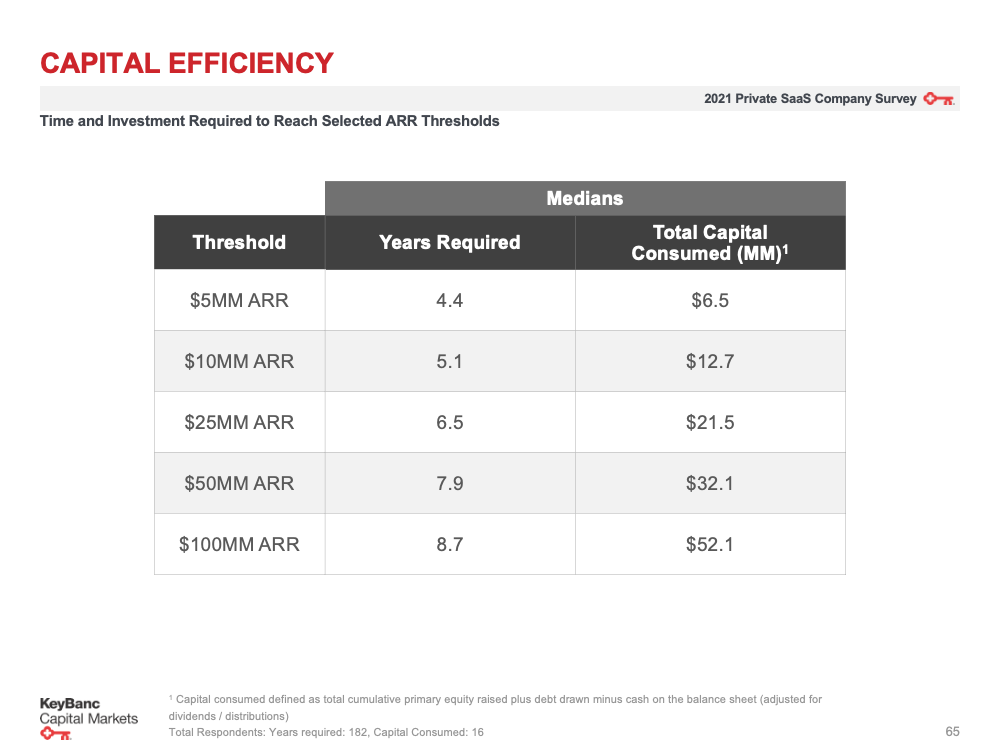
-
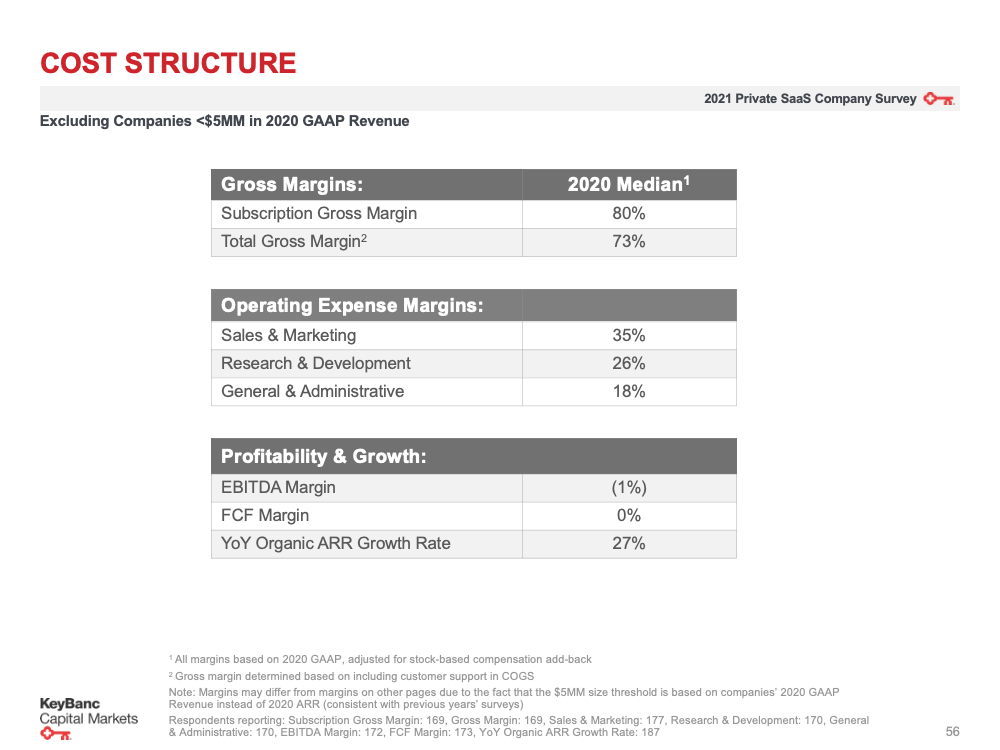
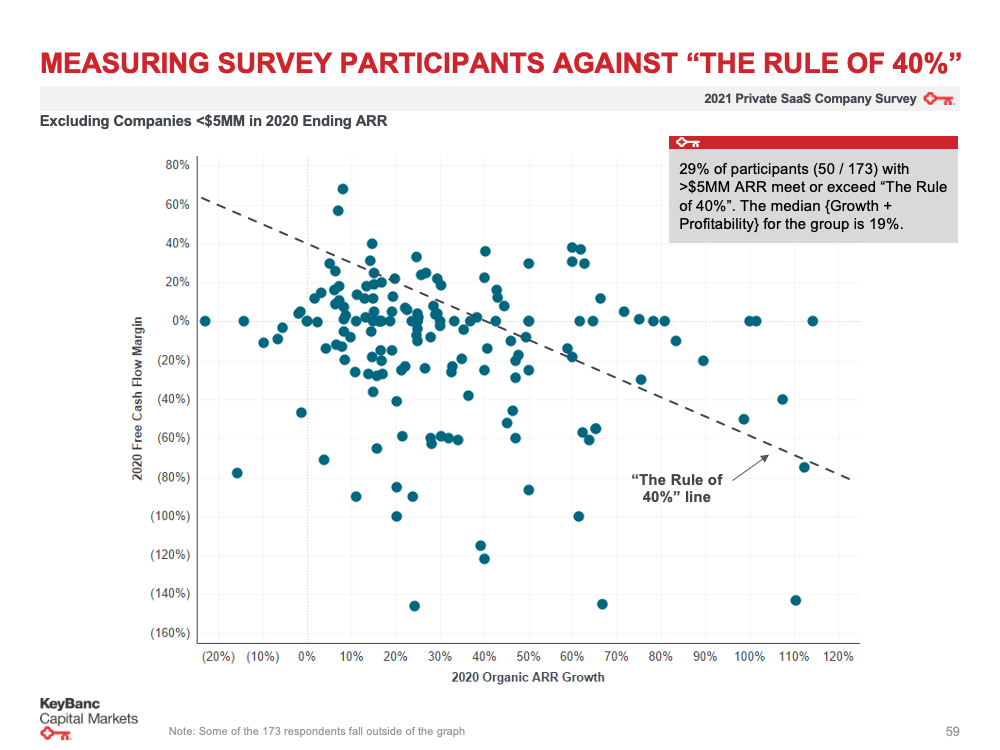
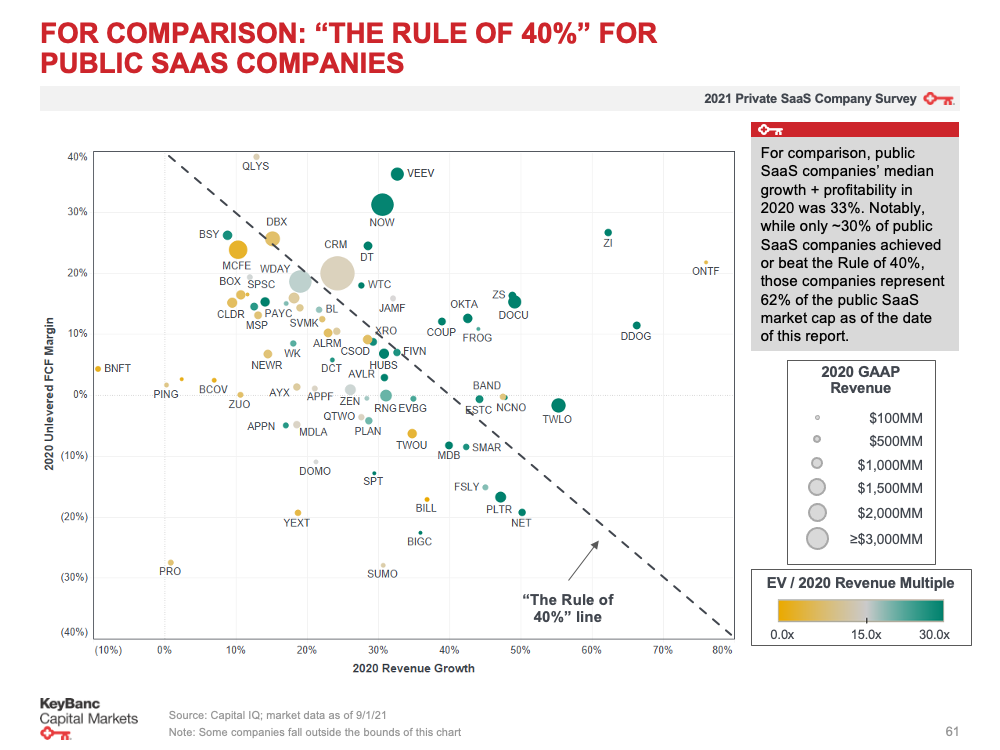
The Reign of Capital Efficiency: The era of growth-at-all-costs has definitively given way to a balanced approach where growth must be matched with clear paths to profitability and strong unit economics. Companies that fail to optimize their CAC payback and gross margins will find themselves at a severe disadvantage when raising capital.

-
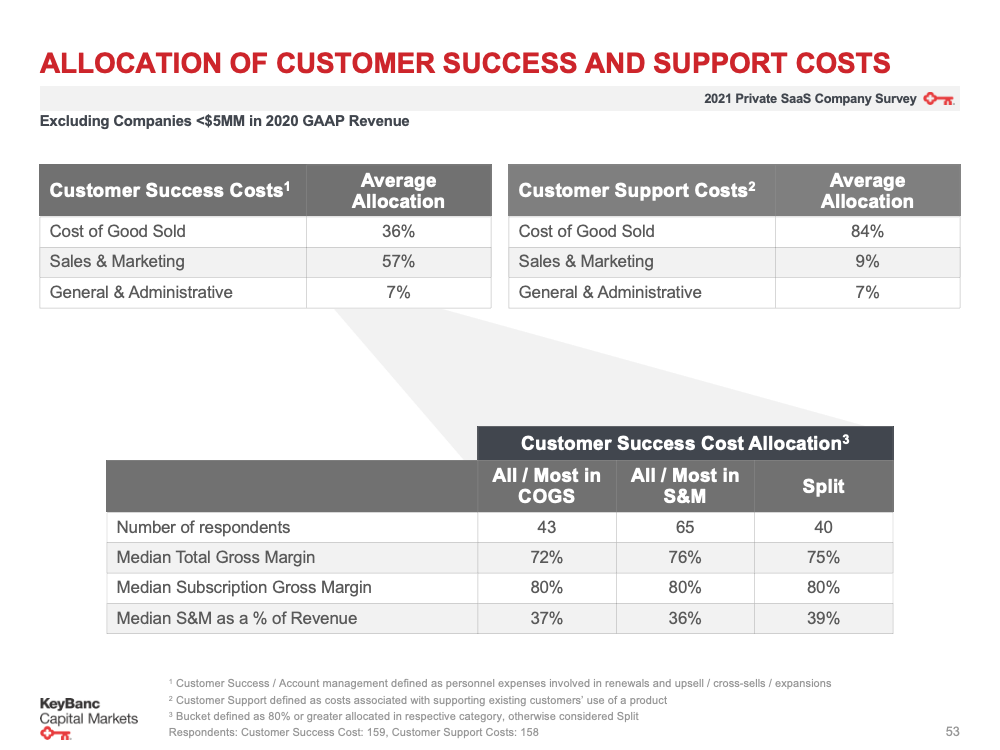
Customer Success as a Growth Engine: With customer acquisition costs remaining high, protecting and expanding existing accounts through world-class customer success is no longer optional. High NRR is the hallmark of enduring software businesses.

-
Adaptability in GTM Strategies: The blurring lines between product-led growth (PLG) and enterprise sales require modern software firms to adopt hybrid go-to-market motions. Utilizing self-serve onboarding to capture user demand while deploying high-touch enterprise sales teams for large accounts is becoming the standard playbook for market leaders.

For organizations seeking to dive deeper into the raw data, methodological notes, and granular slide-by-slide breakdowns, both the first part of the survey and the comprehensive 2021 KBCM SaaS Survey PDF remain essential reading. As the software industry continues to evolve, empirical benchmarks of this caliber will remain indispensable tools for building enduring, highly valuable technology enterprises.
Related posts: