Mastering Business Performance: A Comprehensive Guide to 15 Essential Reports and Modern Management Tools

Effective corporate governance and operational oversight require continuous tracking of work against established milestones alongside transparent communication channels for stakeholders. In the modern corporate landscape, relying solely on ad-hoc updates is no longer viable for organizations aiming to maintain competitive advantage. Consequently, businesses increasingly turn to structured business report templates to monitor performance, allocate resources effectively, and communicate strategic goals clearly.
The Evolution of Corporate Reporting and Strategic Oversight
Historically, internal reporting was a fragmented exercise, with departments operating in data silos. Sales teams tracked revenue independently of project managers monitoring milestones, while human resources managed workloads without visibility into financial forecasts. Over the past decade, the evolution of standardized business frameworks has shifted organizational focus toward integrated reporting.
The primary objective of a business report is twofold: internal performance monitoring and external stakeholder accountability. Without a centralized mechanism to evaluate key performance indicators (KPIs), executive leadership risks making reactive decisions based on outdated metrics. To address this, organizations utilize standardized instruments ranging from high-level dashboards to granular post-action analyses. Below is an examination of 15 essential business report templates, detailing their functional utilities and operational impacts.
1. Project Dashboard Business Report Template
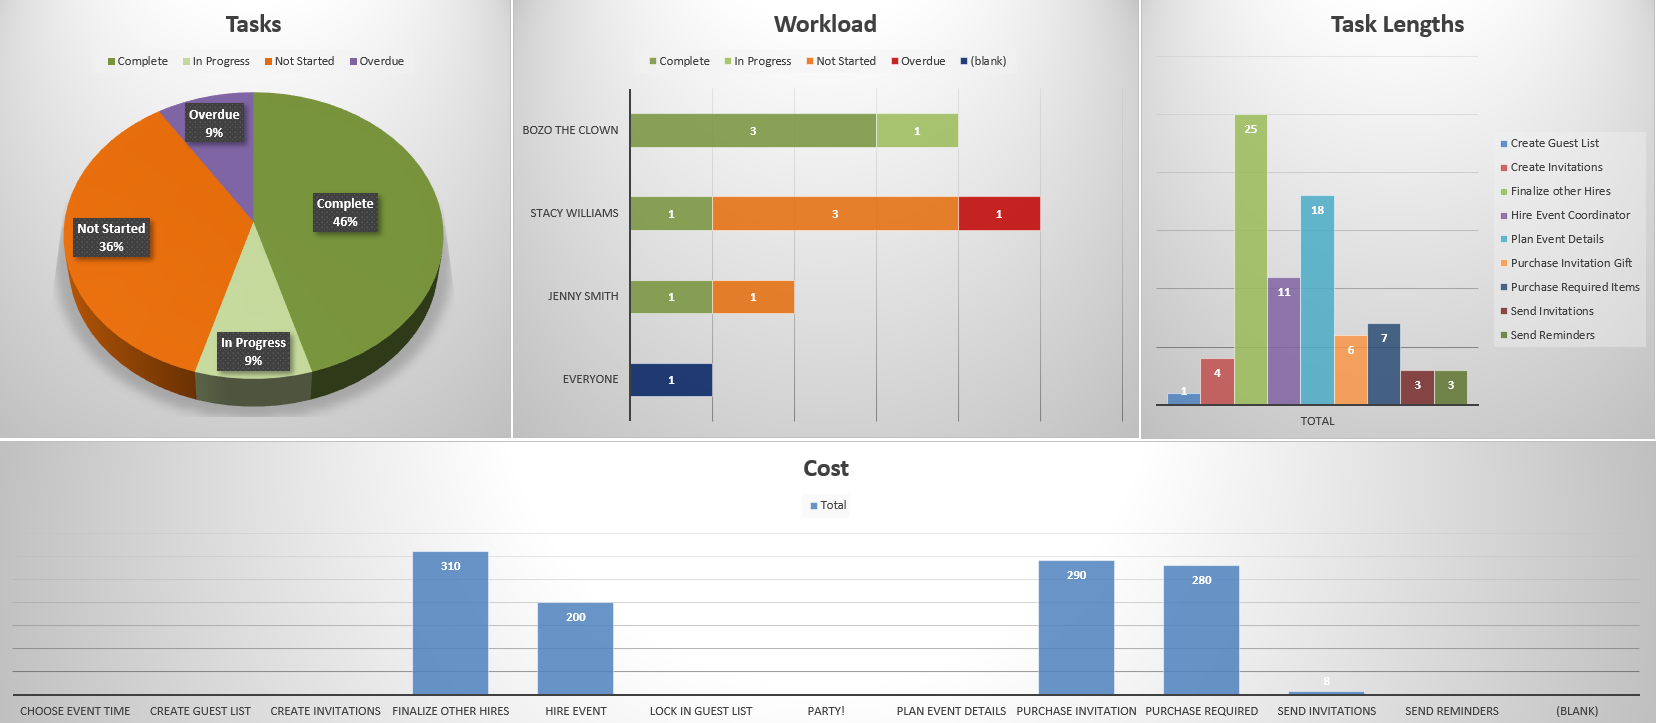
A project dashboard serves as a high-level command center, capturing critical KPIs to provide managers with an instant status report. These tools track whether a project is progressing according to schedule, evaluate cost alignment against allocated budgets, and monitor overall resource deployment. While traditional Excel-based dashboard templates effectively visualize tasks, workloads, and durations through embedded charts, they suffer from inherent limitations. Manual data entry introduces latency, rendering inputted metrics outdated before reviews even begin.
2. KPI Dashboard Template
Key performance indicators quantify organizational success, but raw data spread across disparate spreadsheets obscures the broader strategic picture. A KPI dashboard template consolidates these metrics into a single visual interface, accelerating trend identification and anomaly detection. Executive teams utilize these templates during regular reporting cycles to compare current performance against targeted benchmarks, fostering a culture of data-informed decision-making.
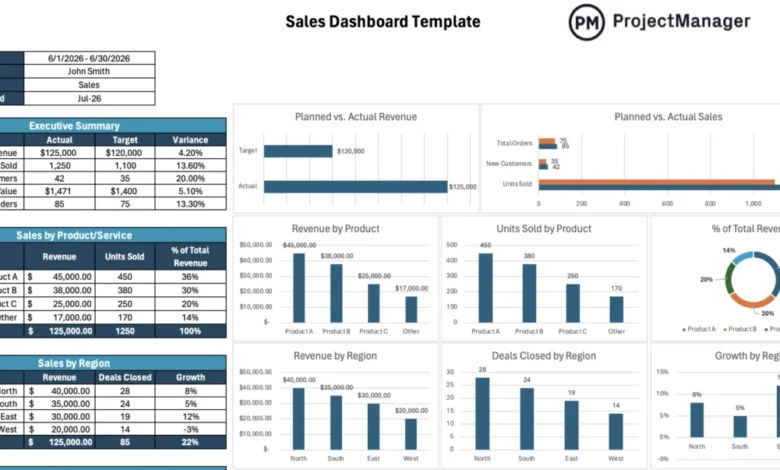
3. Sales Dashboard Template
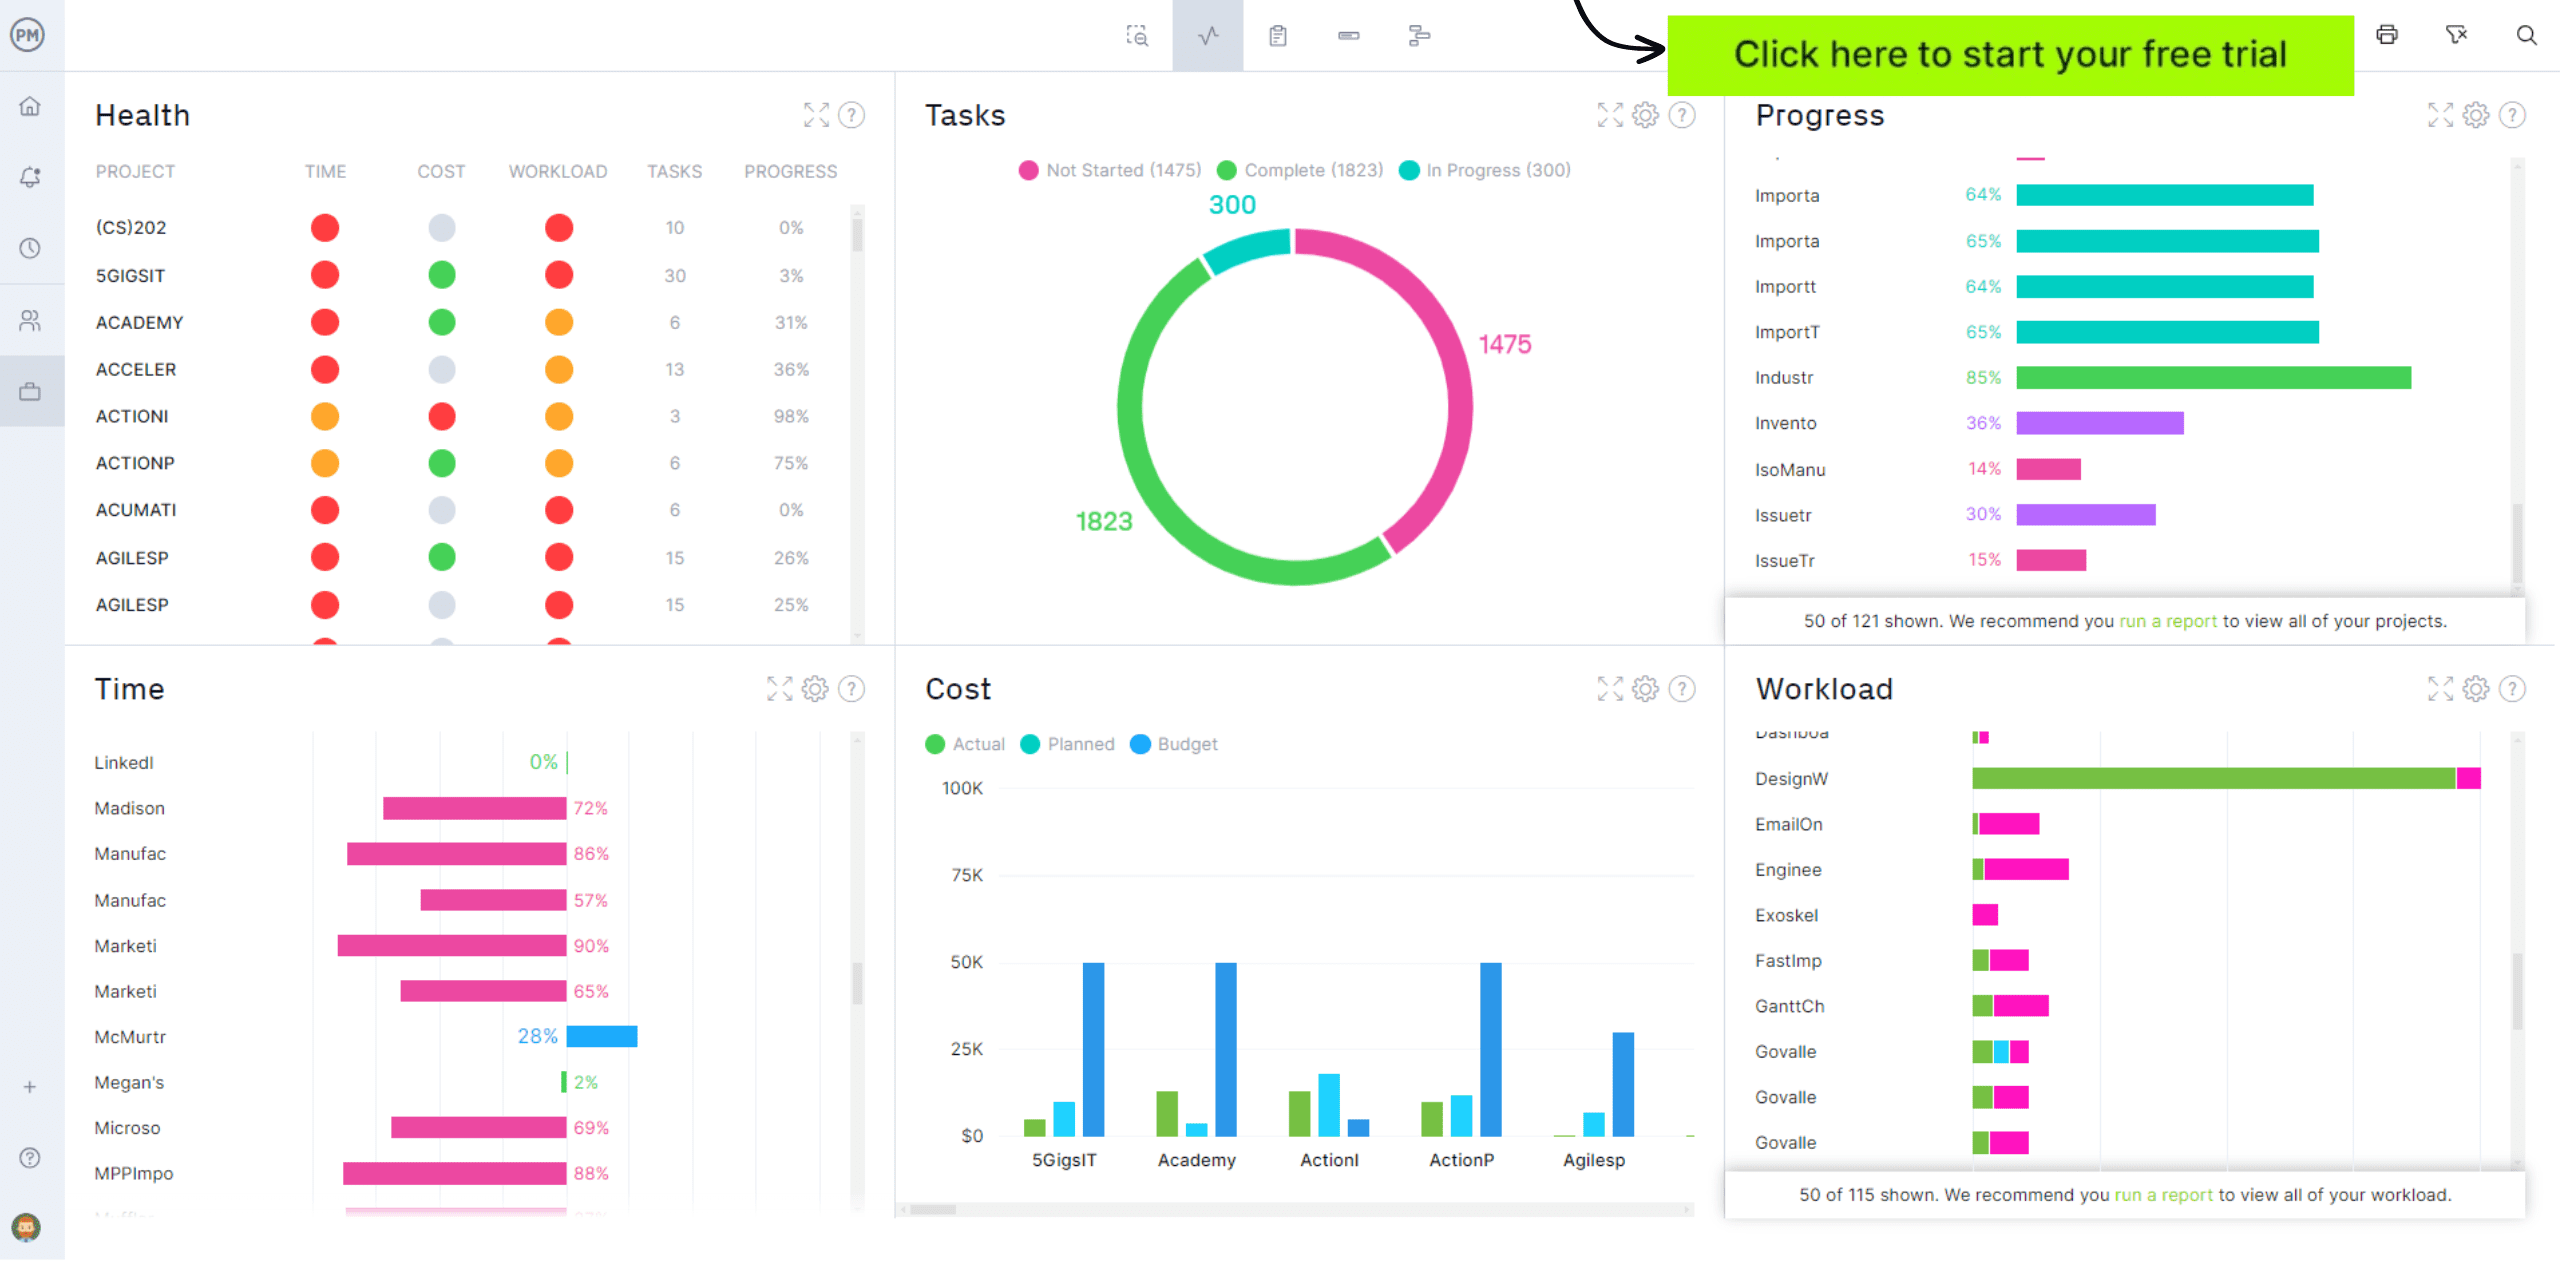
Fragmented sales data across different regions, product lines, and sales representatives often leads to missed market trends. A centralized sales dashboard template aggregates revenue figures, pipeline values, conversion rates, and quota attainment levels. Sales leadership relies on these visual summaries during weekly reviews and quarterly business evaluations to pinpoint underperforming sectors and realign teams with overarching corporate targets.
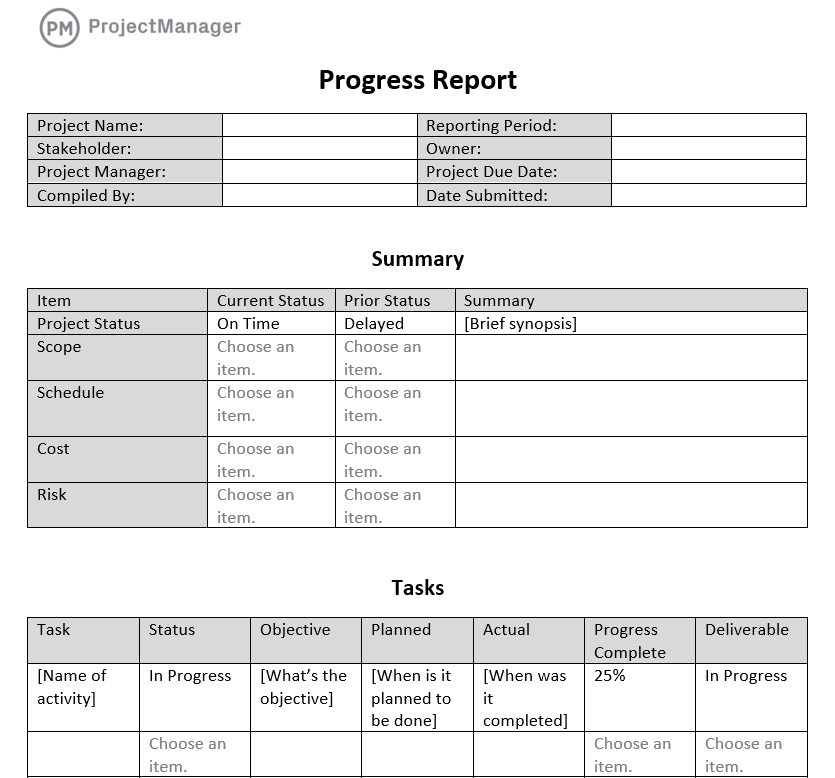
4. Progress Report Template
Progress reports capture operational snapshots over specific intervals, detailing activities completed during a given timeframe. Unlike broad strategic overviews, these documents focus heavily on milestones, emerging risks, issues, and change requests. Utilizing a structured progress report template allows project managers to verify schedule adherence while simultaneously providing stakeholders with transparent updates. Early review of these reports often facilitates proactive dialogue regarding potential roadblocks before they escalate into critical failures.

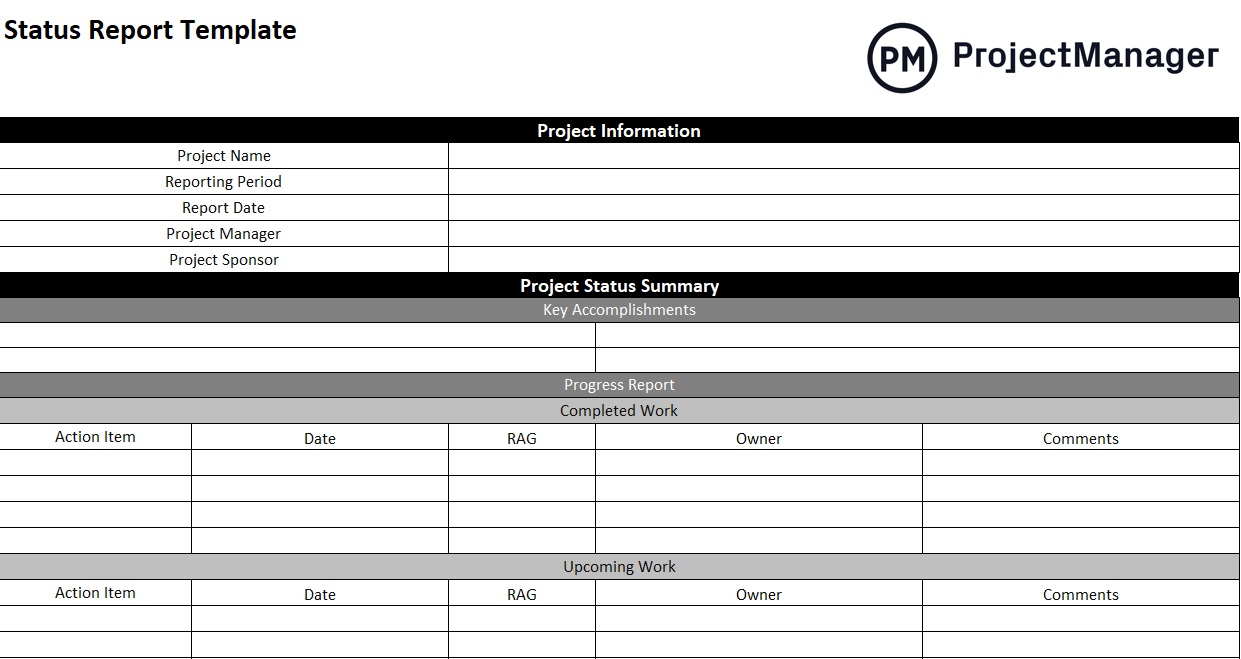
5. Project Status Report Template
While frequently confused with progress reports, a project status report offers a macro-level overview of an entire initiative relative to its baseline plan. Where progress reports drill down into specific tasks and interim milestones, status reports evaluate overall project health. These documents typically incorporate executive summaries, financial health indicators, and risk management overviews to guide steering committees on future project trajectories.
6. Marketing Report Template
Modern marketing departments run simultaneous multi-channel campaigns across digital and traditional mediums, making performance attribution challenging. A marketing report template synthesizes reach, engagement, conversion rates, and expenditure data into a cohesive format. This structured evaluation enables marketing executives to assess campaign efficacy and reallocate advertising budgets toward high-performing initiatives.
7. After Action Report Template
Organizations that fail to conduct formal post-project evaluations frequently repeat operational errors. An after-action report (AAR) template provides a systematic framework for reviewing what was planned versus what actually occurred. By documenting successes, failures, and lessons learned immediately following project closure, teams convert operational hindsight into institutional knowledge for future initiatives.
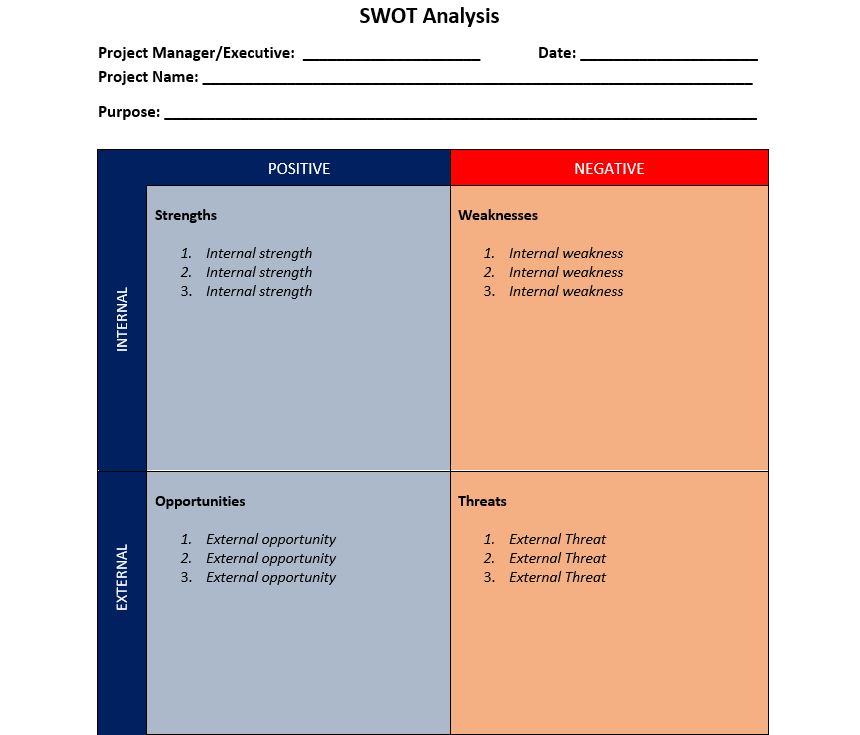
8. SWOT Analysis Business Report Template
Strategic planning requires a rigorous evaluation of internal capabilities and external market dynamics. A SWOT analysis template categorizes organizational data into four distinct quadrants: Strengths, Weaknesses, Opportunities, and Threats. By structuring internal attributes (strengths and weaknesses) against external factors (opportunities and threats), executive boards gain a balanced perspective of their competitive positioning.
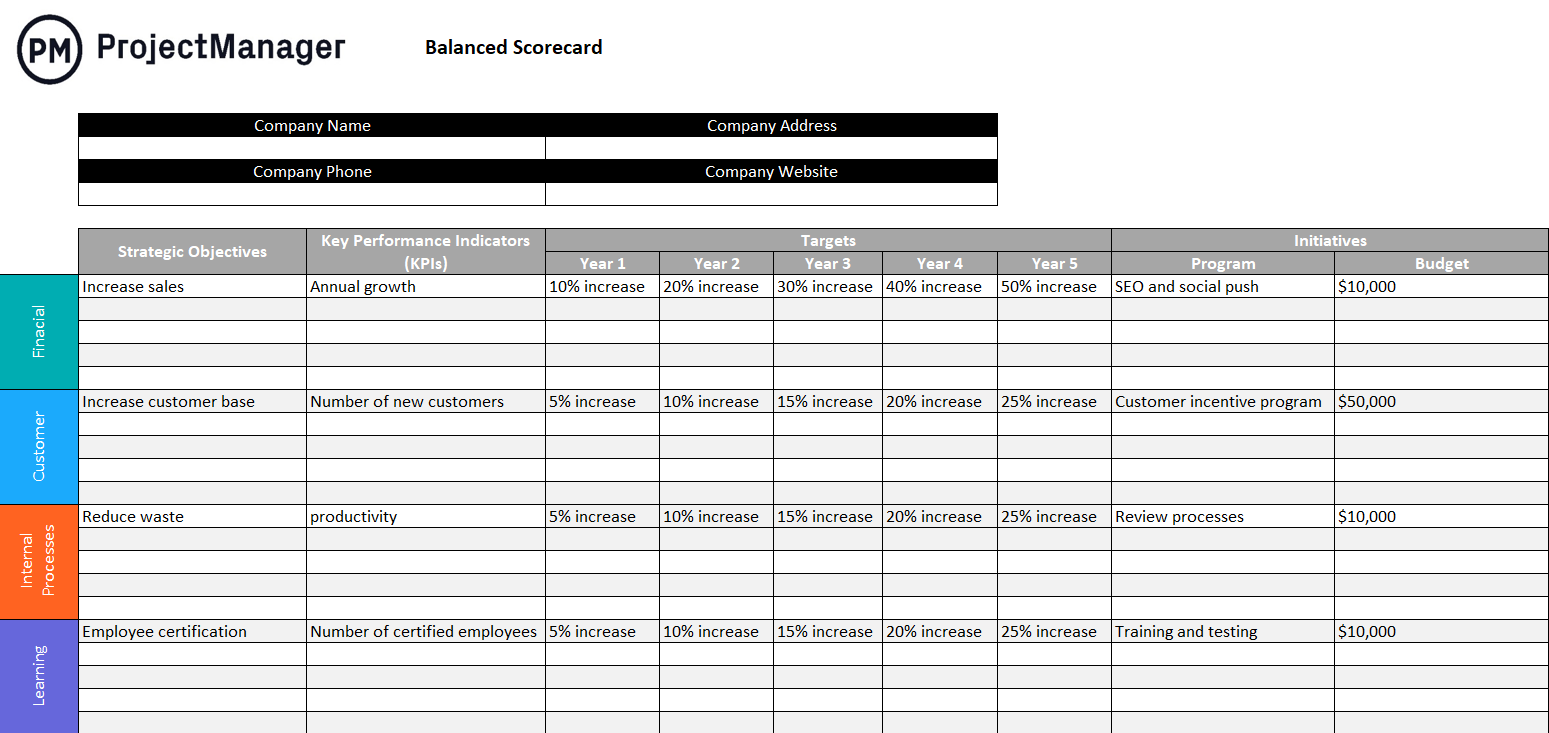
9. Balanced Scorecard Business Report Template
Traditional financial metrics alone fail to capture the holistic health of a modern enterprise. The balanced scorecard methodology integrates traditional financial measures with strategic indicators across four distinct perspectives: financial performance, customer satisfaction, internal business processes, and organizational learning and growth. This comprehensive reporting structure aligns operational activities with long-term strategic ambitions.
10. Gap Analysis Business Report Template
Transitioning an organization from its current operational state to a desired future benchmark requires identifying performance deficiencies. A gap analysis template isolates specific focus areas—such as process inefficiencies or resource shortages—calculates variance percentages, and establishes remedial timelines. Responsible parties and actionable milestones are clearly mapped to ensure structural alignment across product management and business process improvement initiatives.
11. Cost-Benefit Analysis Template
Before committing capital to new ventures, financial viability must be rigorously tested. A cost-benefit analysis template evaluates projected quantitative costs against anticipated financial returns to calculate return on investment (ROI). By capturing direct, indirect, intangible, and opportunity costs, businesses avoid unprofitable investments and optimize capital allocation.
12. Root Cause Analysis Template
When operational processes fail to meet planned outputs, addressing surface-level symptoms is insufficient. A root cause analysis template, often operationalized through a fishbone (Ishikawa) diagram, uncovers the underlying systemic failures causing defects or variations. Implementing root-cause methodologies is a cornerstone of total quality management, ensuring that product development and operational workflows align with quality standards.

13. Workload Analysis Business Report Template
Human capital is often an organization’s most expensive and constrained resource. Workload analysis templates balance task distribution across project teams, preventing both overallocation (which leads to burnout and high turnover) and underutilization (which erodes productivity). By tracking available work hours, hourly rates, and resource utilization rates, managers maintain optimal operational capacity.
14. Operating Budget Business Report Template
Financial forecasting forms the bedrock of corporate planning. An operating budget template enables organizations across various industries to project revenues and expenditures over quarterly or annual horizons. Beyond mapping financial dimensions, these budgets establish realistic corporate goals, allowing leadership to measure actual financial outcomes against initial forecasts and adapt to unforeseen market expenditures.

15. Inventory Business Report Template
For manufacturing, retail, and operational enterprises, inventory management directly impacts the bottom line. An inventory report template records stock levels, turnover rates, volume metrics, and unit pricing. Crucially, these templates highlight reorder thresholds and replenishment lead times, ensuring that production lines maintain necessary materials without incurring excessive holding costs.
The Limitations of Static Templates and the Rise of Enterprise Software
While business report templates offer accessible frameworks for structured analysis, static documents inherently present operational bottlenecks. Spreadsheets require manual data entry, creating time lags that undermine real-time decision-making. Furthermore, manual compilation diverts valuable human capital away from core project execution.
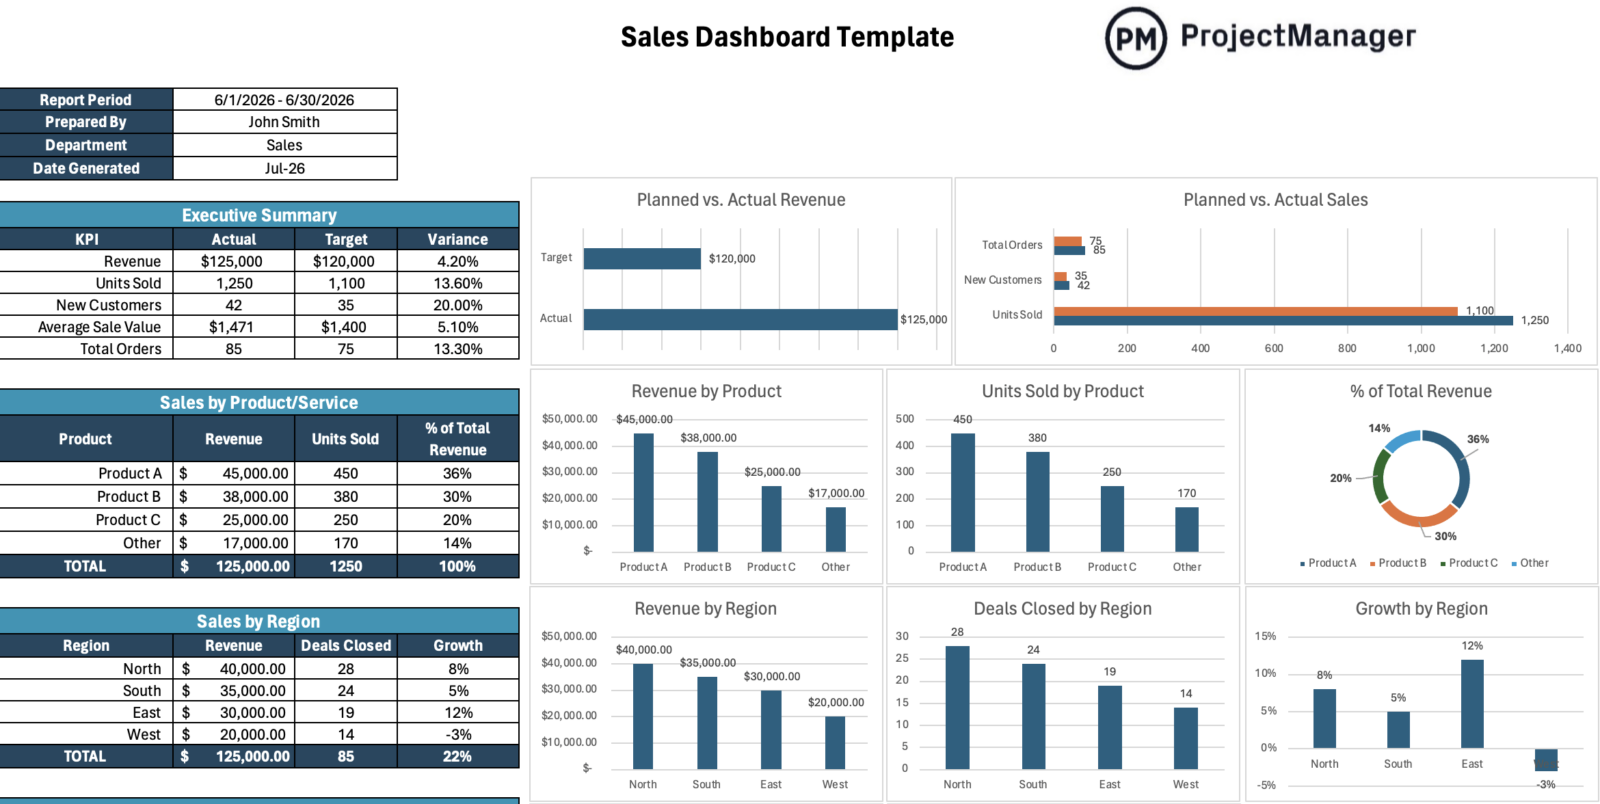
To overcome these inefficiencies, modern enterprises increasingly adopt integrated project and portfolio management (PPM) software. Platforms such as ProjectManager replace static templates with automated, real-time data collection engines. Rather than waiting for manual spreadsheet updates, executives access live dashboards that aggregate metrics across single projects, multi-project programs, or entire enterprise portfolios.
Advanced Reporting and Portfolio Roadmapping
Modern enterprise management software transforms complex data streams into actionable, customizable reports with minimal administrative friction. Automated reporting modules generate comprehensive insights into project status, financial variance, labor allocation, and timesheet utilization instantly. These reports can be filtered dynamically to drill down into specific task assignments or aggregated for high-level stakeholder presentations.
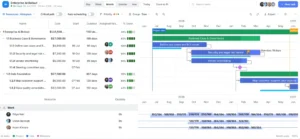
Additionally, portfolio roadmaps utilize interactive, Gantt-chart-like timelines to visualize resource distribution across concurrent initiatives. By mapping team bandwidth against open project pipelines, resource managers eliminate bottlenecks, prevent resource overallocation, and provide transparent forecasting to executive leadership. Ultimately, while foundational templates remain valuable for foundational analysis, real-time enterprise software delivers the agility required in today’s fast-paced corporate environment.