CEO Pay Trends: Financial Services and Biotech Lead the Market While Retail Declines

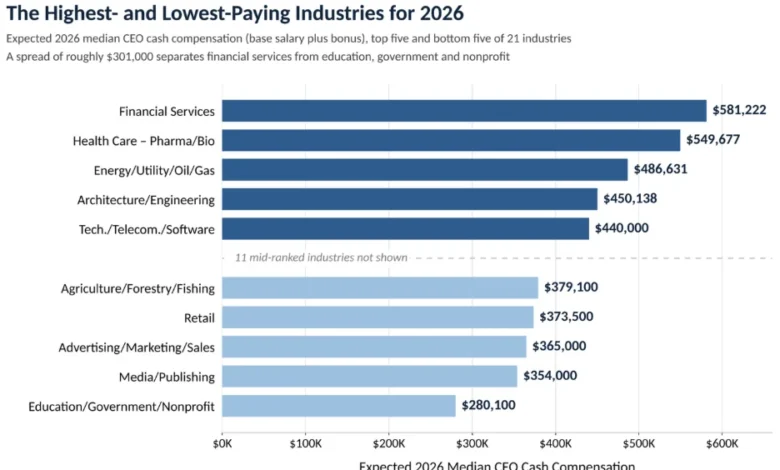
Executive compensation in the private sector is currently defined by a widening chasm between industry leaders and those in service-oriented or mission-driven organizations. According to the latest comprehensive data from the 2026–2027 survey of 1,551 U.S. companies, the landscape of CEO remuneration is increasingly dictated by a combination of sector-specific risk profiles, capital intensity, and the overarching influence of company scale. As boards of directors navigate a complex economic climate, the disparity in median cash compensation—which now spans approximately $300,000 between the highest and lowest-paying sectors—highlights the necessity for more nuanced benchmarking strategies.
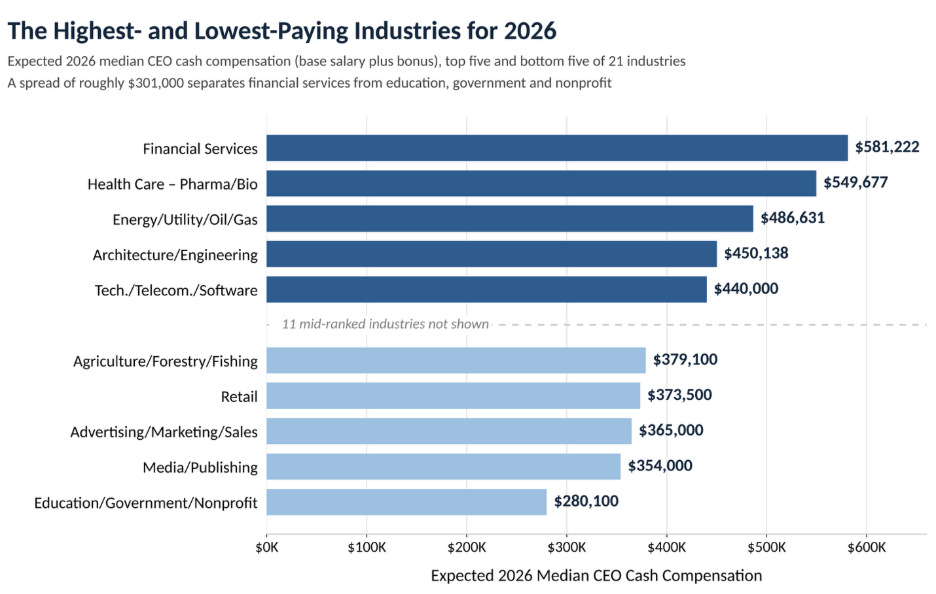
The current hierarchy of executive pay places financial services at the zenith. CEOs in this sector are projected to earn a median cash compensation of $581,222 in 2026, a figure comprised of a $418,722 base salary and a $162,500 bonus. Close behind are leaders in the pharmaceutical and biotechnology industries, who command a median of $549,677. Energy, utilities, and oil and gas firms follow in the third position with $486,631, while architecture and engineering firms, along with technology and software companies, round out the top five, with respective figures of $450,138 and $440,000.
Conversely, the lower end of the compensation spectrum remains occupied by sectors with fundamentally different operational models. Organizations in the education, government, and nonprofit sectors report a median cash compensation of $280,100, less than half of their counterparts in finance. Media and publishing ($354,000), advertising and marketing ($365,000), retail ($373,500), and agriculture ($379,100) complete the bottom tier of the rankings.
A Chronological Perspective on Compensation Volatility
To understand the current state of CEO pay, one must examine the volatility that has characterized the last three fiscal years. The data reveals that industry rankings are not static; rather, they are highly sensitive to market performance and the structure of incentive programs.
In 2024, the financial services sector saw its CEOs forecast a median cash compensation of $597,500. By 2025, that figure dipped to $540,265, likely reflecting a period of market uncertainty and cautious bonus structures. The rebound to $581,222 in 2026 demonstrates the sector’s aggressive reliance on performance-based incentives to attract and retain leadership talent. A similar, albeit more pronounced, trend occurred in the pharmaceutical and biotechnology sector, where pay dropped from $532,312 in 2024 to $476,517 in 2025, only to surge to $549,677 in 2026.
Analysis of these figures confirms that the primary driver of this recent rebound is the variable component of compensation. In the pharma/biotech sector, median bonuses climbed from $90,000 in the 2025 forecast to $150,000 for the upcoming year, while base salary adjustments remained relatively stagnant. This suggests that boards are increasingly tethering executive rewards to the successful navigation of long-term R&D pipelines and the complexities of regulatory approvals, rather than fixed-cost growth.
In stark contrast, the energy sector has exhibited remarkable stability, with median compensation hovering between $485,256 and $491,616 over the same period. This suggests that while energy firms are highly profitable, their compensation models are more conservative and less prone to the cyclical, bonus-driven swings observed in financial services and life sciences.
The Confounding Variable of Company Size
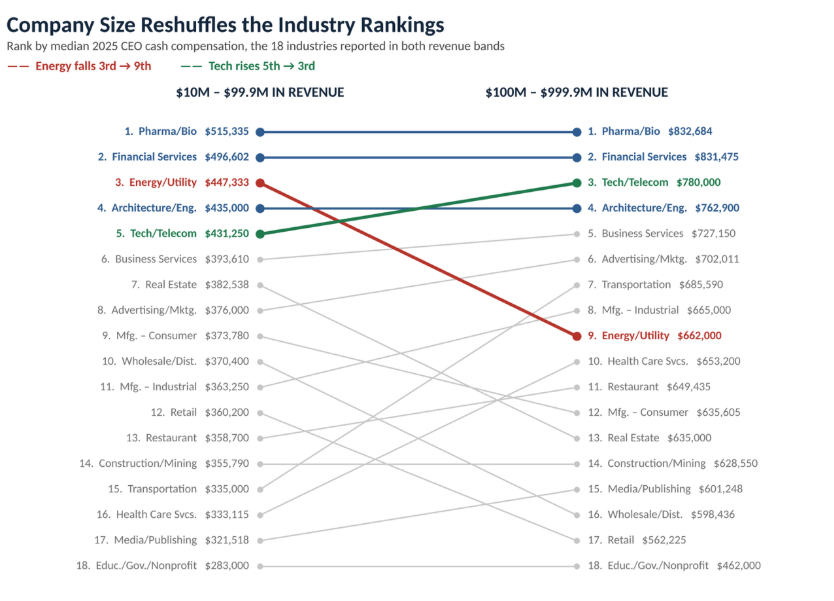
A critical finding in the 2026–2027 report is the danger of relying on siloed industry averages. While industry classification is a common starting point for compensation committees, company size—often measured by annual revenue—frequently serves as a more accurate predictor of total pay.
When segmenting companies by revenue, the competitive landscape shifts significantly. For companies generating between $10 million and $99.9 million, pharmaceutical and biotechnology firms maintain the lead at $515,335. However, in the $100 million to $999.9 million revenue bracket, the dynamic changes. While pharma and finance remain at the top with median figures exceeding $830,000, technology firms ascend to the third position at $780,000.
This suggests that for technology firms, the scale of the enterprise is a more significant catalyst for compensation growth than it is for other industries. Smaller tech firms may operate with tighter budgets, but as they scale, their ability to offer high-end compensation to CEOs grows exponentially to match the demands of rapid innovation and intense global competition.
Implications for Corporate Governance and Boards
For compensation committees, the message is clear: reliance on broad industry averages can lead to misaligned pay strategies. If a company benchmarks its CEO salary against a sector average without accounting for its specific revenue tier or ownership structure, it risks either overpaying for talent or losing its most valuable executives to competitors.
The data also highlights a concerning trend for the retail sector. Retail CEO compensation has experienced a steady decline, falling from $411,695 in 2024 to an expected $373,500 in 2026. This contraction is largely attributed to a sharp reduction in bonus payouts, which fell by over 36% during the same timeframe. Industry analysts note that this shift likely reflects the intense pressure retail firms face regarding thin profit margins, rising labor costs, and a volatile consumer environment. As retail models pivot toward omnichannel strategies, the financial bandwidth available for executive incentives has been significantly constrained.
Conversely, industrial manufacturing and wholesale distribution have shown signs of recovery. After a dip in 2025, industrial manufacturing CEO pay is projected to reach $412,500 in 2026, signaling a resurgence in operational stability and perhaps a pivot toward long-term strategic investment within the sector.
Strategic Factors Driving Compensation Differentials
Beyond simple supply and demand, the structure of executive pay is a direct reflection of the challenges inherent in each industry’s business model.
In financial services, the premium is placed on risk management, capital allocation, and regulatory navigation. The massive bonus potential—often the largest in the market—reflects the direct link between a CEO’s decision-making and the firm’s bottom-line profitability. Conversely, the architecture and engineering sector places a higher percentage of total compensation on base salary, with bonuses accounting for roughly 50.2% of the base, reflecting a more project-based, stable revenue model.
In the nonprofit and government spheres, the constraints are not purely financial but are instead driven by public perception and stakeholder oversight. Compensation in these sectors has remained strikingly flat, with 2026 projections of $280,100 representing only a marginal increase from the $275,850 recorded in 2024. This suggests that these sectors operate under a fixed-compensation paradigm that is largely insulated from the market-driven volatility seen in the private sector.
Looking Toward 2027: The Need for Rigorous Benchmarking
As companies prepare for the 2027 fiscal year, the data underscores three primary imperatives for boards. First, boards must move beyond top-line industry data and prioritize "peer-group" benchmarking that accounts for revenue, geographic footprint, and industry complexity. Second, the reliance on variable pay as a performance lever is becoming more granular; boards should look at how specific KPIs in their sector are being weighted in current bonus structures. Third, there is a clear trend toward rewarding CEOs who can navigate macroeconomic headwinds—such as the inflationary pressures affecting the retail sector—through operational efficiency rather than just market expansion.
The ongoing shifts in executive pay are more than just numbers on a spreadsheet; they are indicators of how different industries are adapting to the risks of the mid-2020s. Whether it is the biotechnology sector’s reliance on high-stakes R&D bonuses or the retail sector’s struggle to maintain margins, these compensation trends serve as a barometer for the health and strategic direction of the broader U.S. economy. For organizations looking to retain top-tier leadership, the lesson is that compensation is not a one-size-fits-all metric. It is a strategic tool that must be tailored to the unique economic pressures, competitive landscape, and operational realities of the specific industry in which the firm operates.