Unlocking the SaaS Blueprint: Key Insights and Performance Metrics from the Seventh Annual Private SaaS Company Survey


The enterprise technology sector relies heavily on accurate benchmarking to measure financial health, operational efficiency, and market trajectory. For the seventh consecutive year, the collaborative research initiative between the entrepreneurship resource platform forEntrepreneurs and KBCM Technology Group (formerly Pacific Crest Securities) has delivered a comprehensive analysis of the private Software-as-a-Service (SaaS) market. Drawing data from approximately 424 private SaaS companies, this landmark study—spearheaded by contributors like David Spitz alongside the analytical teams at KBCM—offers an invaluable empirical window into the mechanics of high-growth technology firms. As macroeconomic pressures fluctuate and venture capital allocators demand stringent capital efficiency, understanding the median performance metrics of these organizations provides critical guidance for founders, executives, and investors navigating the competitive software landscape.
Background, Methodology, and Survey Demographics
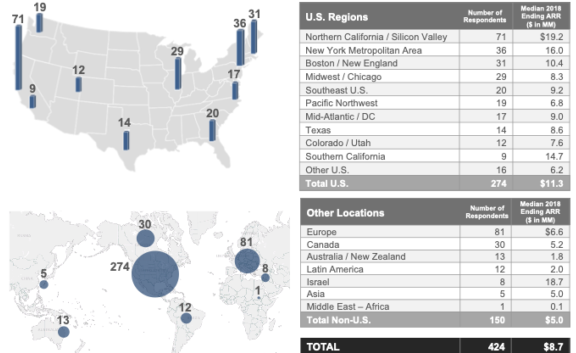
To fully appreciate the conclusions drawn from the 2018 performance metrics, context regarding the composition of the surveyed entities is paramount. The survey captured a globally diverse yet predominantly North American cohort of private SaaS enterprises, mapping their operational footprints across various revenue tiers and geographic headquarters. The distribution of participating companies spanned a wide spectrum of scale, ranging from early-stage startups generating less than $2.5 million in Annual Recurring Revenue (ARR) to massive, mature market players scaling past the $100 million ARR threshold.
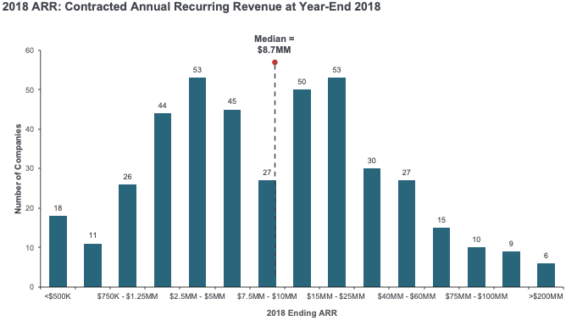
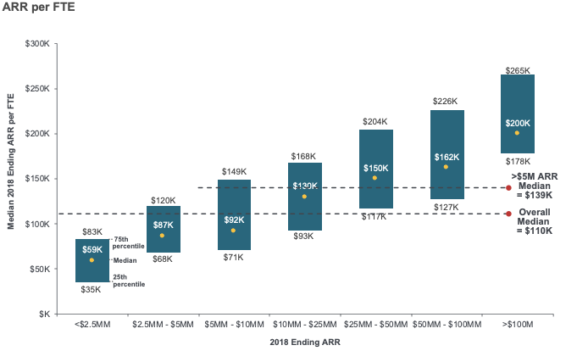
Specifically, the participant size distribution highlighted a healthy representation across growth stages: nearly 100 respondents reported ARR under $2.5 million, while over 100 participants commanded ARR between $10 million and $25 million, ensuring that insights were not skewed exclusively toward either micro-startups or late-stage giants. Furthermore, the geographical distribution confirmed that while the majority of headquarters remain anchored in major North American technology hubs, an increasingly globalized SaaS ecosystem contributes to the underlying dataset. Human capital efficiency—measured through ARR per Full-Time Equivalent (FTE)—served as a foundational baseline across these diverse operational models, demonstrating how headcount scaling correlates directly with top-line revenue generation.
Organic ARR Growth and the Growth-versus-Burn Tradeoff
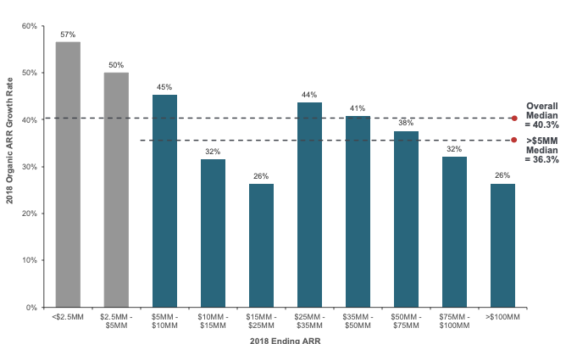
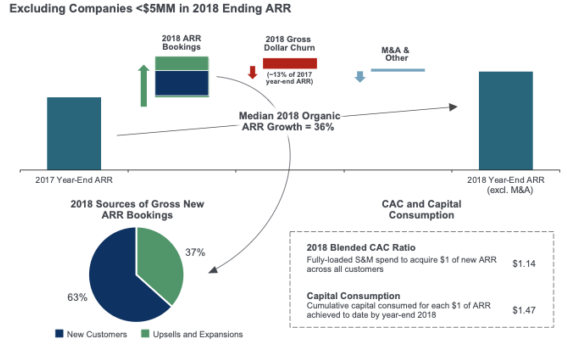
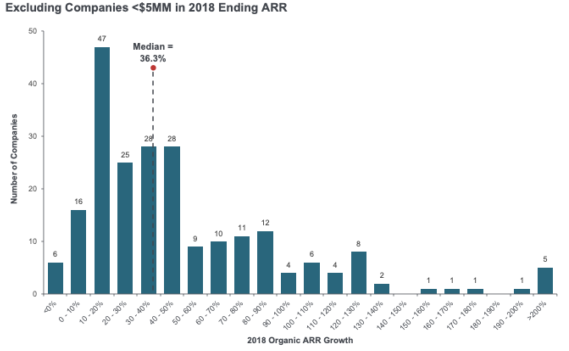
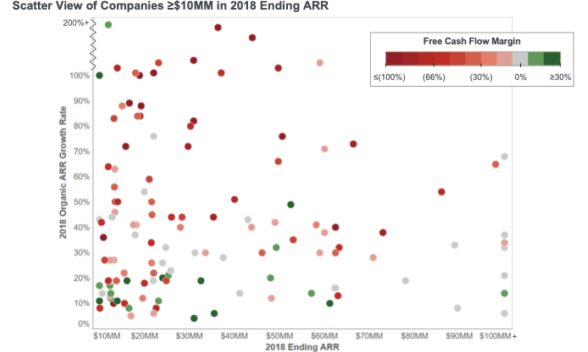
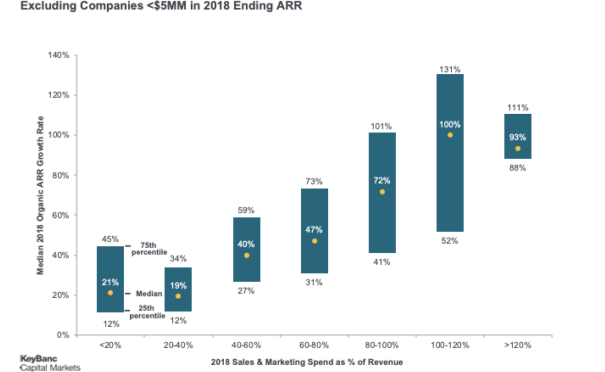
Growth remains the primary valuation driver for SaaS companies, yet the calculus governing how that growth is achieved has undergone significant evolution. The survey’s deep dive into organic ARR growth—deliberately excluding inorganic expansions driven by mergers and acquisitions—reveals the underlying momentum of private operators. Median organic ARR growth rates remained robust across cohorts, though performance varied heavily depending on the baseline size of the firm and its target market segment.
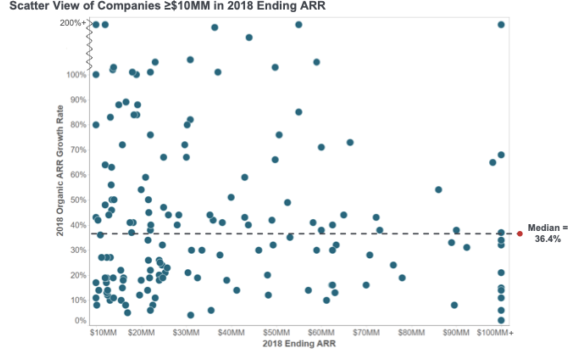
A central tension explored in the report is the classic growth-versus-burn tradeoff. High-growth SaaS companies frequently outspend their current revenue streams to capture market share, consuming primary cumulative equity and debt to fuel customer acquisition. However, the data illuminates a shifting sentiment toward capital discipline. Investors and executive teams are increasingly evaluating the In-Year Capital Consumption Ratio and Cumulative Capital Consumption Ratio to determine whether high burn rates are yielding proportional, sustainable revenue expansion. Companies that achieved high organic growth while maintaining reasonable capital efficiency stood out as outliers of operational excellence, proving that hyper-growth does not inherently require undisciplined cash consumption.
Go-To-Market Strategies: Field Sales vs. Inside Sales and Contract Dynamics
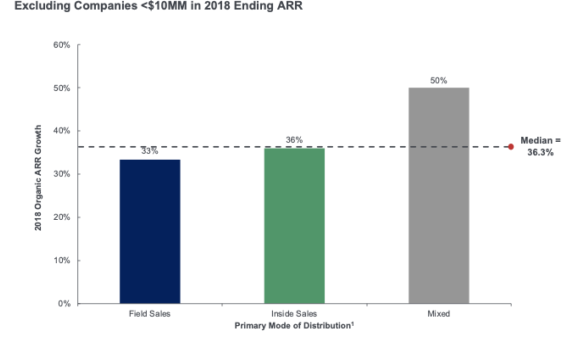
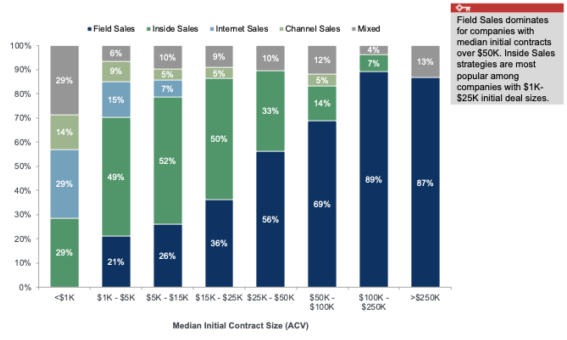
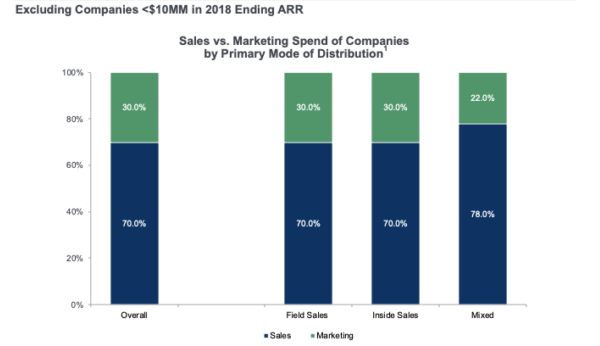
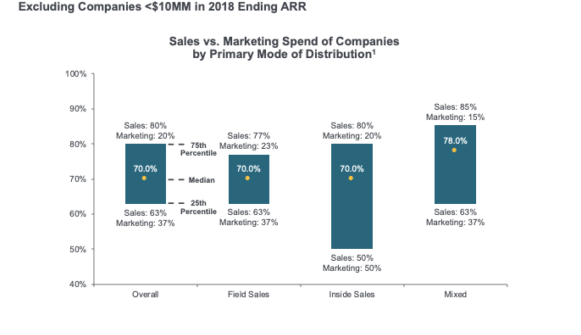
Go-to-market (GTM) execution dictates how efficiently a SaaS company converts prospects into committed subscribers. The survey provides a granular look at primary modes of distribution, categorizing firms by their reliance on field sales, inside sales, mixed strategies, internet-driven self-service, and channel partnerships.
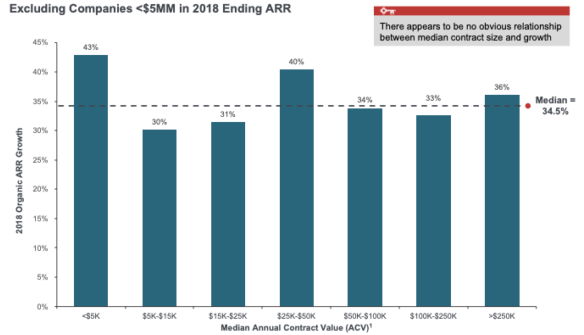
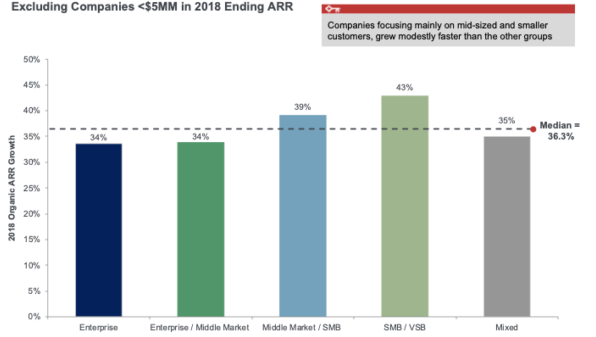
A critical finding emerges when analyzing sales strategies through the lens of contract size and target customer demographics. Enterprise-focused companies targeting organizations with over 1,000 employees overwhelmingly rely on field sales models, justifying higher upfront customer acquisition costs (CAC) with substantial Annual Contract Values (ACV) exceeding $250,000. Conversely, businesses targeting Small and Medium-Sized Businesses (SMBs) and Very Small Businesses (VSBs) lean heavily on inside sales or velocity-based digital models to maximize transaction volume at lower price points.
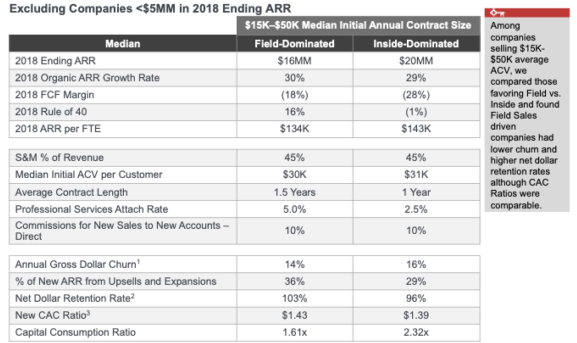
The report also evaluates the crossover tiers where field and inside sales models intersect. In these contested ACV brackets, companies must carefully balance fully-loaded sales and marketing expenditures against the lifetime value of the customer. Direct commission structures for sales teams—including incentives for renewals, multi-year commitments, and upsells—reveal how compensation design directly influences net retention and churn mitigation.
Customer Acquisition Costs (CAC) and Capital Efficiency

Understanding the true cost of acquiring and retaining customers is foundational to SaaS unit economics. The survey establishes clear definitions for CAC ratios, distinguishing between blended CAC, new customer acquisition costs, and the cost of securing upsells and expansions within existing accounts.
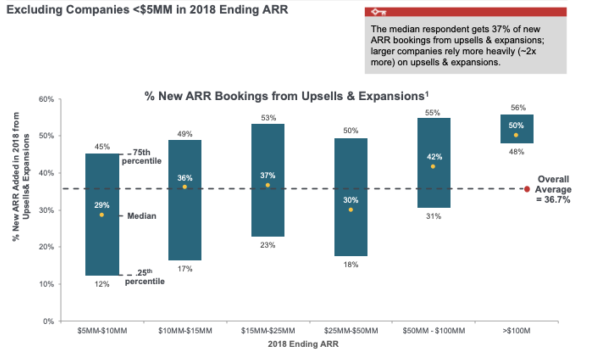
Implied CAC payback periods—calculated by dividing the CAC ratio by subscription gross margins—quantify the number of months of subscription gross profit required to recover fully-loaded acquisition outlays. The data indicates that median payback periods cluster within predictable ranges depending on sales motion, though top-quartile performers demonstrate significantly compressed timelines. When cross-referenced with capital consumption metrics, the findings underline a stark reality: companies with elongated CAC payback periods deplete their balance sheets at a much faster rate, making them acutely vulnerable to tightening venture debt and equity financing markets. Net dollar retention, gross churn, and the reliance on upsells and expansions further compounded these dynamics, illustrating that retaining and expanding existing accounts is often far more capital-efficient than acquiring brand-new logos.
Operational Trends, Cloud Delivery, and Gross Margins
Operational infrastructure forms the backbone of any scalable SaaS enterprise. The report details evolving subscription gross margins, noting that respondents systematically backed out stock-based compensation while factoring in comprehensive customer support expenses to maintain reporting integrity. Median subscription gross margins remained remarkably resilient, typically hovering in the high-seventies to low-eighties percentage range.
An analysis of SaaS application delivery trends since 2014 underscores the total industry convergence toward public cloud infrastructure. Amazon Web Services (AWS) retained its position as the predominant hosting environment for the vast majority of surveyed companies, followed by Microsoft Azure, Google Cloud, and various hybrid or multi-cloud configurations. Self-managed physical servers have become an extreme minority, utilized almost exclusively by legacy operators or specialized firms with strict data-sovereignty mandates. This widespread cloud adoption has standardized delivery costs, directly supporting stable subscription gross margins regardless of company size. Additionally, professional services attach rates were analyzed as a percentage of first-year ARR, demonstrating how implementation complexity varies significantly when selling to enterprise clients versus SMB markets.

Implications and Future Outlook for Private SaaS
The collective insights from the seventh annual KBCM and forEntrepreneurs survey offer a strategic roadmap for executive leadership teams charting their course for the future. The data confirms that while top-line growth remains the ultimate badge of success in the software sector, the market is increasingly intolerant of inefficient capital allocation.
As SaaS companies mature, leadership must continuously calibrate their go-to-market motions—optimizing the balance between field and inside sales, refining commission structures to encourage net revenue retention, and monitoring CAC payback periods with rigorous discipline. By benchmarking their internal metrics against the median performances of over 400 peers, founders and financial officers are better equipped to make informed strategic pivots, secure favorable financing terms, and build durable, highly valued software enterprises capable of weathering shifting macroeconomic tides. The full report, complete with supplementary data tables and expanded histogram distributions, remains available for download through KBCM Technology Group and related industry resource portals.